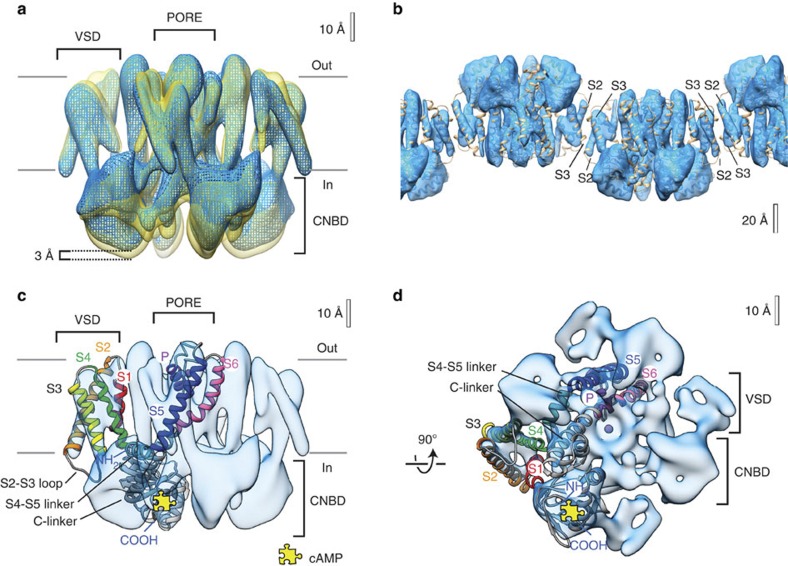
Figure 1. 3D cryo-EM maps reveal MloK1 conformations in the presence and absence of cAMP.
(a) Superimposed density maps of cAMP-bound (mesh, blue) and cAMP-free (solid, yellow) forms of MloK1. The membrane region as well as the intra- and extracellular sides (labels in and out) are indicated. The channel without ligand is ~3 Å longer than its cAMP-bound counterpart. An equivalent isocontour level was used for both structures. (b) The protein–protein contacts between adjacent, oppositely oriented, cAMP-bound MloK1 tetramers in the 2D crystals are established via the S2 and S3 helices of the VSDs. The model of cAMP-bound MloK1 (brown) is overlapped on the cryo-EM map, which is displayed as raw data without the resolution limitation to 7 × 7 × 12 Å. (c) Density map of MloK1 in the presence of cAMP (blue) shown from the membrane plane, and (d) shown from the intracellular side. A fitted atomistic structure is threaded through one of the subunits. The yellow jigsaw puzzle piece marks the location of the cAMP-binding site; K+ and/or Ba+ ions are depicted in purple. Atomistic fitting of the 3D maps was performed using a homology model for MloK1 based on the X-ray structure of the transmembrane region (PDB ID 2ZD9 (ref. 18)) and the X-ray structure of CNBD in the presence of cAMP (PDB ID 3CL1 (ref. 14)).

