Figure 3.
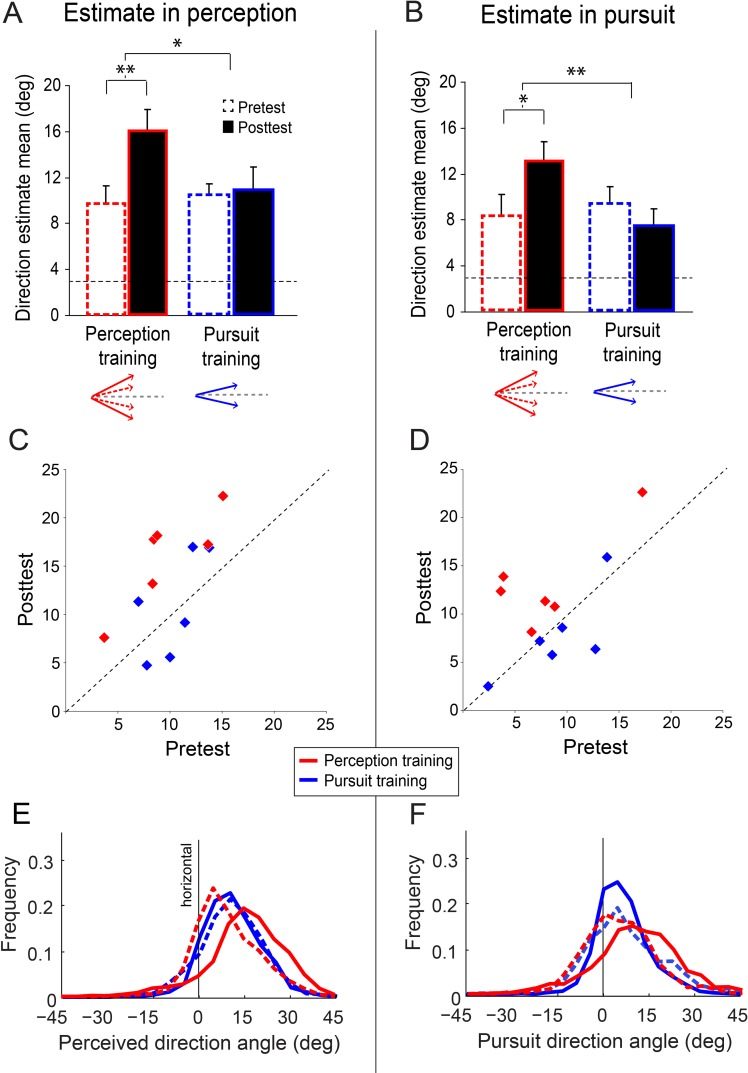
Direction estimates in perception and pursuit angles. Direction estimates in perception (A, C, E) and pursuit (B, D, F) before (dashed) and after (solid) perception training (n = 6, red) and pursuit training (n = 6, blue) in Experiment 1. (A, B) Asterisks indicate significant differences (*p < 0.05, **p < 0.01). Horizontal grey dashed line represents the presented direction (±3°). Perception training significantly affected estimates for both perception (A) and pursuit (B), indicating transfer of PL. Schematic of reported directions below graphs. Values are means ± standard error of the mean (SEM) (C, D) Individual observer data. Only observers in perception training consistently changed their direction estimates and their pursuit angles. (E, F) Frequencies of responses (bin size 5°) in perception (E) and pursuit (F) for 3° motion directions.

