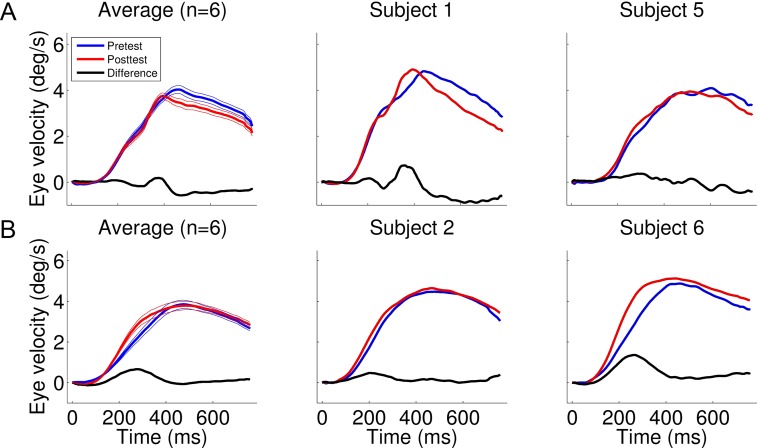
Figure 6.
(A, B) Two-dimensional eye velocity traces in pretest (blue) and posttest (red) sessions and the difference (black) for the perception-training group (A) and the pursuit-training group (B). The left panels depict the means and the standard error of the means, and the middle and right panels show two observers who illustrate individual differences (typical in naïve observers). Target speed was 10°/s. For illustration purposes, data were filtered with an additional 75-ms window average and normalized to the mean fixation position prior to stimulus onset. Filtered individual data were averaged to create the mean across observers.

