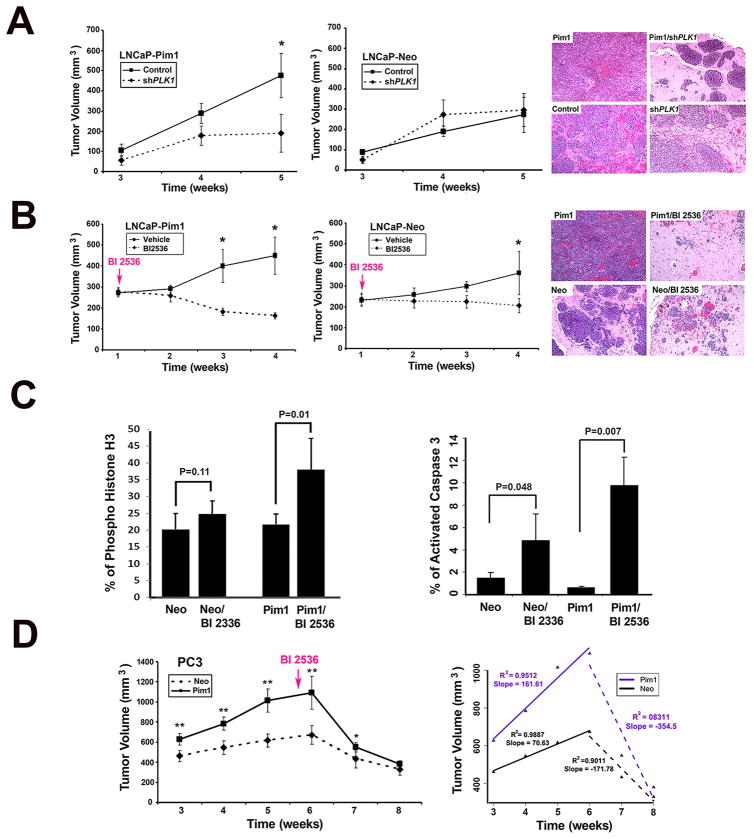
Figure 3. Targeting PLK1 inhibits tumor progression in Pim1 overexpressing prostate tumors.
A (left), shPLK1 and shControl LNCaP-Pim1/Neo cells were injected into flanks of nude mice and tumor volumes measured over time. Mean tumor volume ± SD are shown. N = 10 per group; (right) H&E images of representative grafts from each group. Magnification, x 20.
B (left), LNCaP-Pim1/ Neo cells were grafted subcutaneously onto nude mice and one week later BI 2536 were injected intravenously. Tumor sizes were measured once a week. Mean tumor volume ± SD are shown. N= 10 per group. Tumor volume was dramatically reduced in BI 2536-treated Pim1 cells; (right) Representative H&E images of each group. Notice massive tumor in Pim1 cells and dramatic reduction of tumors in BI 2536-treated Pim1 cells (Pim1/BI 2536). Neo cells also formed tumor and BI 2536 treatment led to the reduction of tumor, but Pim1 cells were more sensitive to BI 2536 treatment. Magnification, x 20.
C (left), The mitotic index as determined by quantitation of phospho-histone H3 positive cells in BI 2536-treated LNCaP-Neo/Pim1 cells; (right) Quantitation of active caspase 3 positive cells in each group. N = 4 (150–200 cells for each) per group.
D (left), Nude mice bearing PC3-Pim1 and Neo were treated with BI 2536 intravenously for 6 cycles starting from 5.5 weeks after grafting. N =10 per group. Mean tumor volume ± SD are shown; (right) Mean tumor volume of PC3-Pim1 and Neo cells with slope showing kinetics of tumor size before and after BI 2536 treatment. N = 10 per group. *, P < 0.05; **, P < 0.01.

