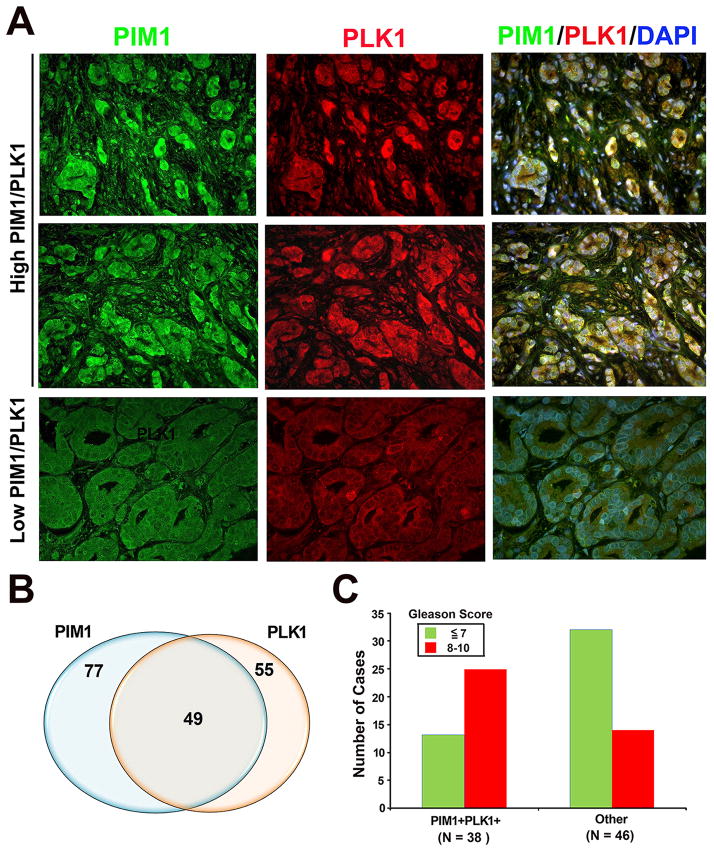
Figure 5. Co-expression of PLK1 and PIM1 in human prostate tumors.
A, Representative images showing high expression levels of PIM1 and PLK1 as well as co-localization in human prostate tumors. Normal prostate glands show low expression levels of both PIM1 and PLK1.
B, Venn diagram showing a significant percentage of human prostate tumor samples co-expressing PIM1 and PLK1. N = 162.
C, Co-expression of PLK1 and PIM1 was significantly correlated to higher Gleason scores (P = 0.00012, Chi-square). Human microarray tissues were immunostained with both PIM1 and PLK1 antibodies.

