
Figure 2.
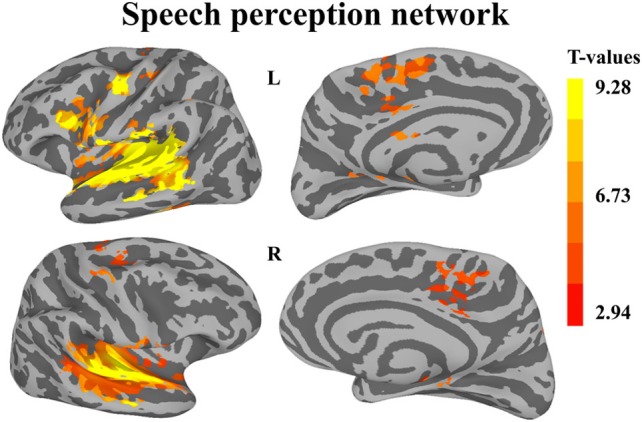
Whole-brain analysis of BOLD response illustrating regions significantly active during speech perception. Activation is shown on the group average smoothed flattened surfaces. All analyses are controlled for multiple comparisons using a cluster extent of 157 vertices, and a single node threshold of p < 0.01, to achieve a family-wise error rate of p < 0.001.