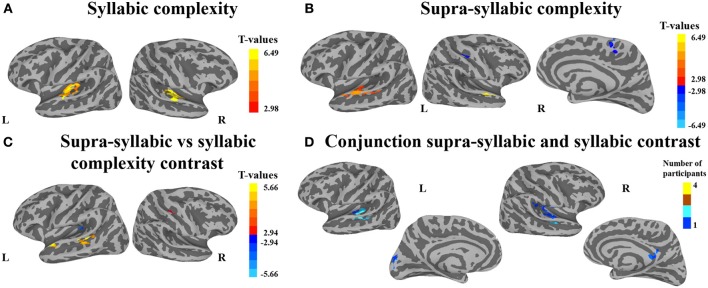
Figure 3.

Whole-brain analysis of BOLD response. Activation is shown on the group average smoothed flattened surfaces. The first three analyses (A–C) are controlled for multiple comparisons using a cluster extent of 157 vertices, and a single node threshold of p < 0.01, to achieve a family-wise error rate of p < 0.001. The last analysis (D) is controlled for multiple comparisons using a cluster extent of 202 vertices, and a single node threshold of p < 0.05, to achieve a family-wise error rate of p < 0.05. Panel (A) illustrates regions significantly active for the contrast between levels of syllabic complexity (complex > simple sequences). Panel (B) illustrates regions significantly active for the contrast between levels of supra-syllabic complexity (complex > simple). Panel (C) illustrates regions that were differently active for the two complexity contrasts ([complex sequence - simple sequence] - [complex syllable - simple syllable]). Panel (D) illustrates regions significantly active for the conjunction of syllabic and supra-syllabic complexity (syllabic complexity ∩ supra-syllabic complexity). The color scheme represents the number of participants in which an overlap between the two manipulations was found (less than 5).
