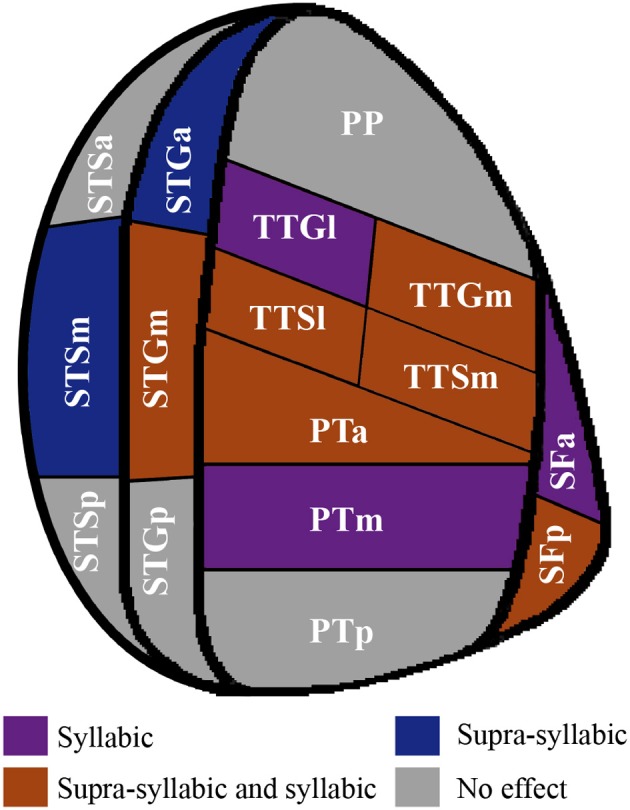
Figure 6.

Patterns of main effects of syllabic and supra-syllabic complexity observed in exploratory STP and STS ROI analysis. The results are shown on a flattened schematic representation of STP and STS showing the parcellation used in this study (different areas shown not to scale). Areas in dark purple are those that exhibited a main effect of syllabic complexity, areas in blue are those that exhibited a main effect of supra-syllabic complexity, areas in orange are those that exhibited where both an effect of syllabic and supra-syllabic complexity were observed and areas in gray are those that exhibited no effect was observed. Legend: PP, planum polare; TTG, transverse temporal gyrus (m, medial, l, lateral); TTS, transverse temporal sulcus (m, medial, l, lateral); PT, planum temporale (a, anterior, m, middle, p, posterior); SF, caudal Sylvian fissure (a, anterior, p, posterior); STG, superior temporal gyrus (a, anterior, m, middle, p, posterior); STS, superior temporal sulcus (a, anterior, m, middle, p, posterior).
