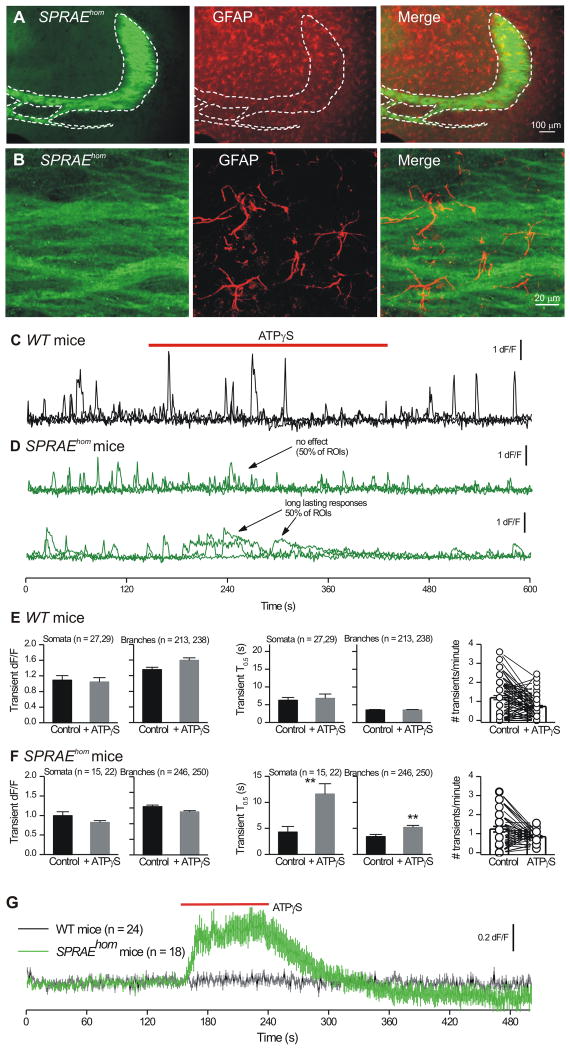
Figure 5. Stratum lucidum region astrocyte Ca2+ responses during glutamate release from mossy fibers in SPRAEhom mice.
A. IHC for P2X2-YC in the mossy fibers (green) along with staining for astrocytes using GFAP (red); higher magnification views shown in panel B. C. Three representative traces superimposed for ROIs from astrocyte branches from a WT mouse before, during and after 100 μM ATPγS applications. D. As in C, but for astrocytes located in the s.l. region and imaged from SPRAEhom mice. E. Properties of astrocyte Ca2+ signals before and during ATPγS applications in WT mice. F. Properties of astrocyte Ca2+ signals before and during ATPγS applications in SPRAE mice. However, there was no significant difference in the duration of the spontaneous Ca2+ transients in WT and SPRAE mice before ATPγS. For somata, in WT mice their T0.5 was 6.2 ± 0.9 s and in SPRAE mice the T0.5 was 4.3 ± 1.1 s (n = 27 and 15; p = 0.16 with an unpaired t test). For branches, in WT mice their T0.5 was 3.5 ± 0.2 s and in SPRAE mice the T0.5 was 3.4 ± 0.4 s (n = 213 and 246; p = 0.83 with an unpaired t test). G. S.l. region astrocyte cell surface glutamate imaging with iGluSnFR in WT and SPRAEhom mice. Average data are shown as mean ± S.EM.

