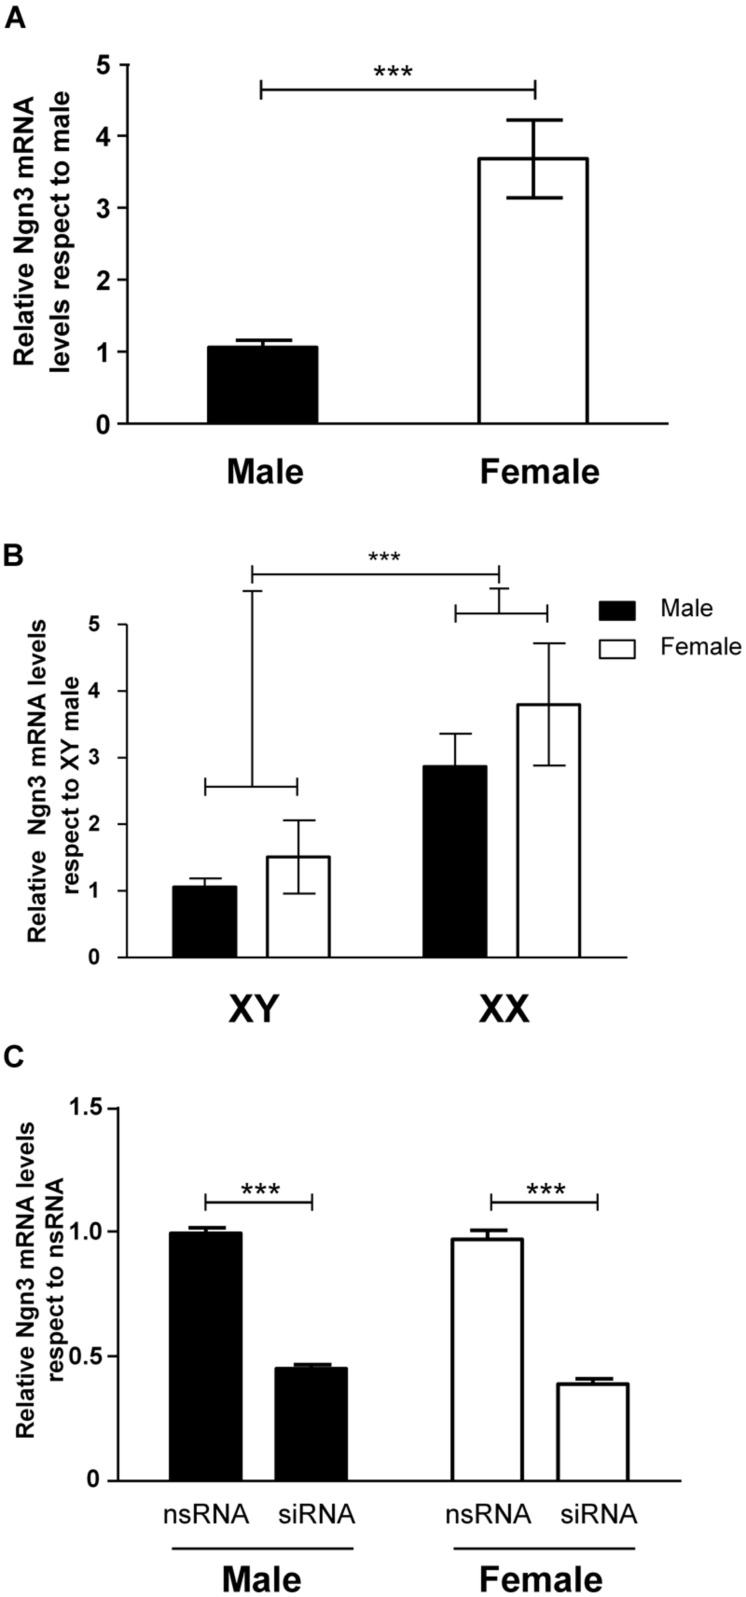
FIGURE 4.
Sex differences in the expression of Ngn3 in primary hypothalamic neurons. (A) Ngn3 mRNA levels in male and female hypothalamic neurons at 3 DIV. (B) Ngn3 mRNA levels in the four core genotype model. (C) Validation of siRNA targeting Ngn3 (siRNA) and a control non-targeting siRNA (nsRNA) in male and female hypothalamic cultures. Data are mean ± SEM. n = 6–9 independent cultures for each sex and treatment. LSD test indicated significant differences ***p < 0.001.

