
Figure 1.
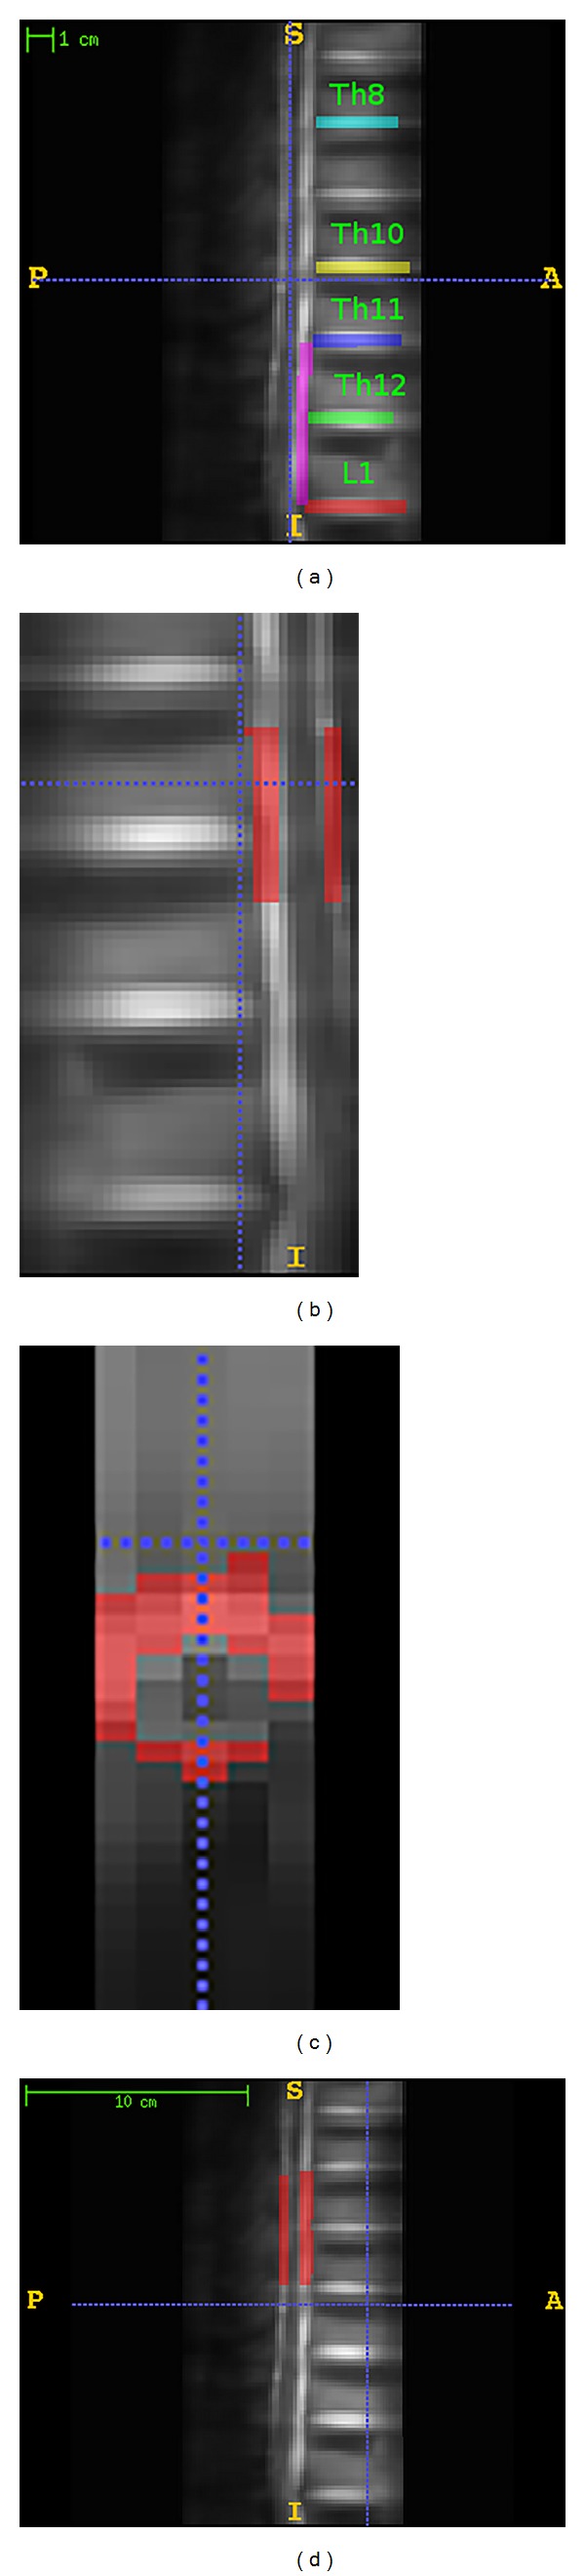
(a) Labeling of the mean T2 images of a representative individual subject in one session. Different colors (intensities) were used for different labels, and each color shows one label. Th denotes the thoracic and L denotes the lumbar vertebrae. (b) Illustration of the ROI, sagittal view. (c) Illustration of the ROI, axial view. (d) Illustration of the secondary mask.