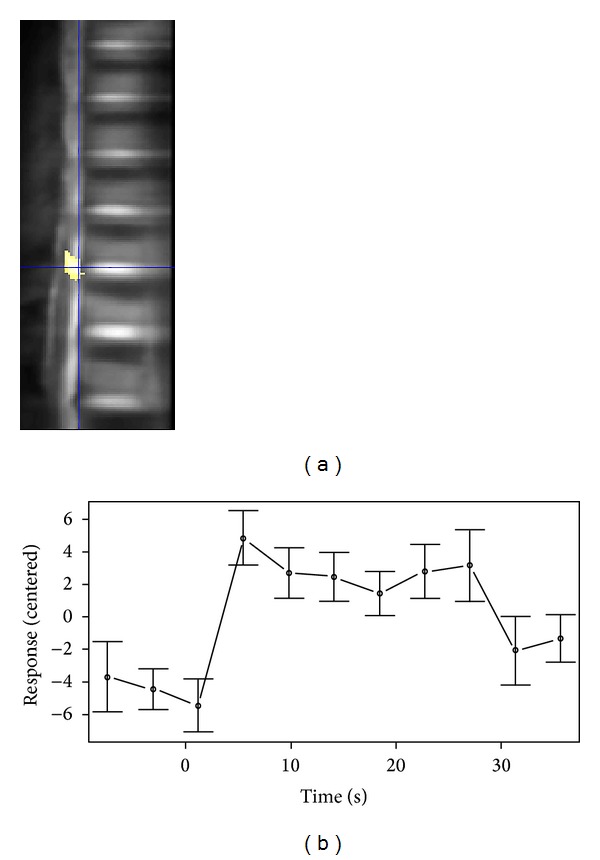
Figure 2.

(a) Activation map across the regions of interest for experts; crosshair shows the peak activation voxel. For visualization the spinal canal is not excluded for this map. (b) Per-task response averaged across ten repetitions for one subject. Data was centered; error bars indicate SEM.
