
Figure 3.
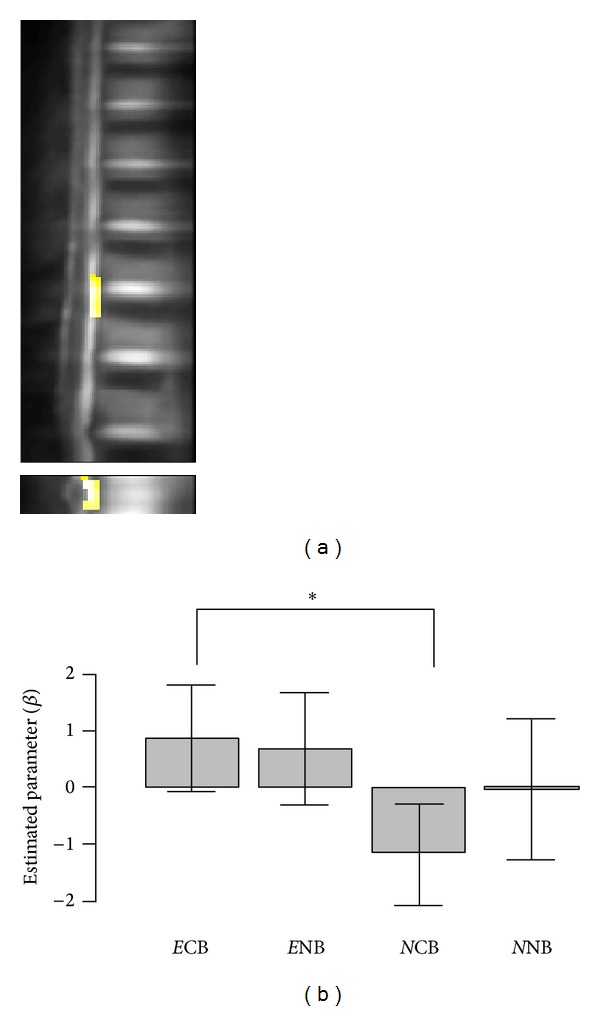
(a) Activation map across the regions of interest for E-N, sagittal and axial views. (b) Average spinal neural activity induced by the task for each session and group masked by the ROI. E and N, expert and novices; CB and NB denote sessions; error bars indicate standard error of the mean. * denotes P < 0.05.