
Figure C.19.
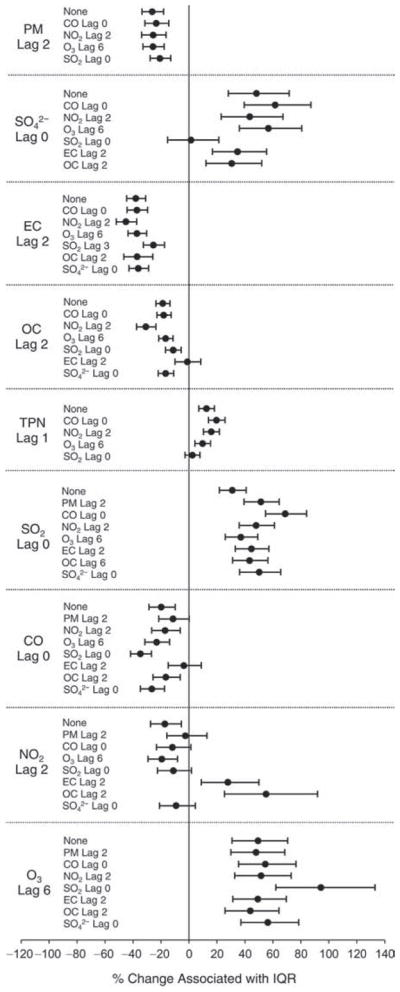
Estimated means and 95% CIs for the percent change in EBC nitrate level associated with one IQR increase in pollutant concentration, controlling for temperature (df = 2), RH (df = 1), 7-day moving average of temperature (df = 3), 3-day moving average of RH (df = 3), sex, day of the week, and a second pollutant.