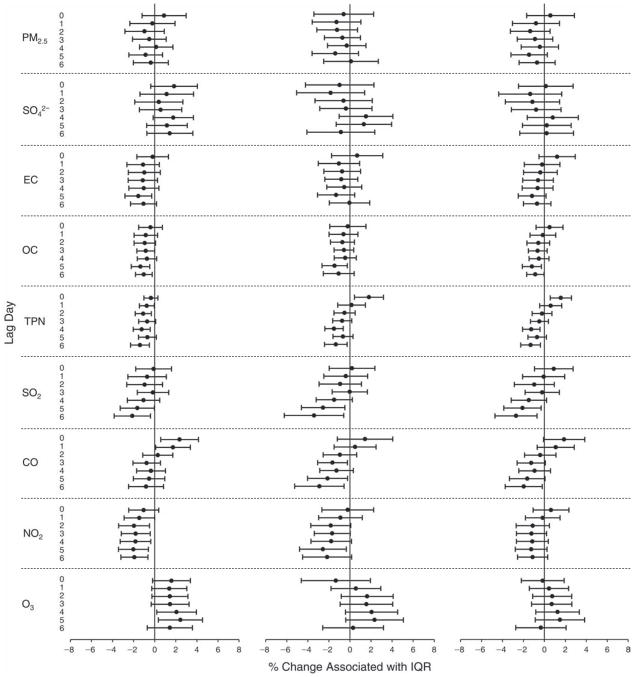
Figure K.13. Estimated means and 95% CIs for the percent change in WBC count associated with one IQR increase in pollutant concentration.
Left: results without any adjustment for temperature or RH; Middle: results with full adjustments; Right: results with adjustments for temperature and RH having statistically significant effects on biomarkers.

