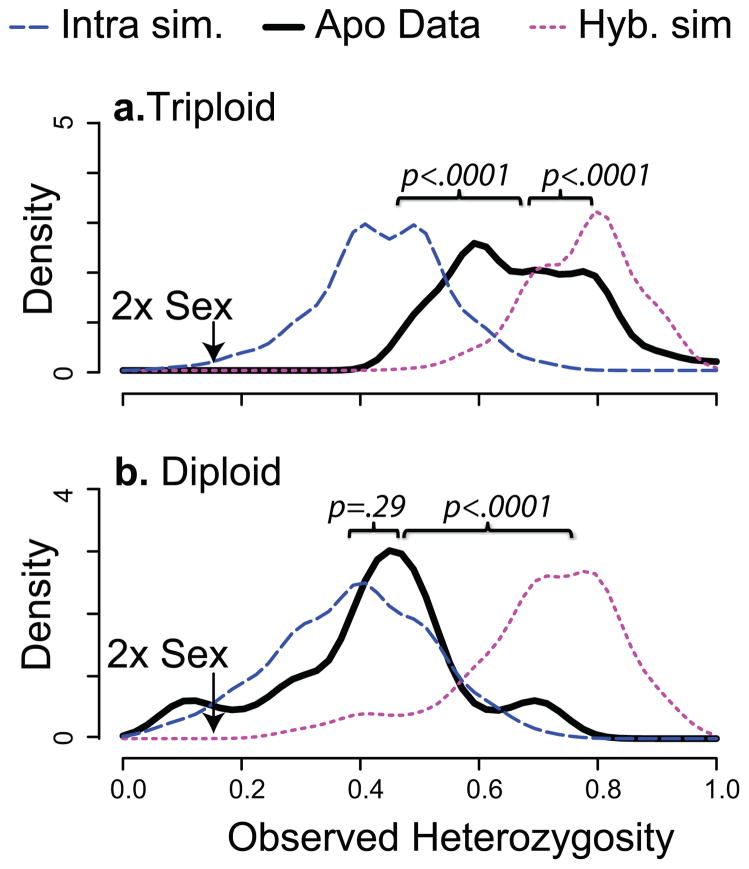
Fig 1.
Patterns of heterozygosity indicate differential origins of 2x and 3x apomixis. Genotypes for eight offspring were calculated for each of 1000 simulated crosses among diploid populations of B. pendulocarpa (Intra sim.) and between B. pendulocarpa and the other diploid species (Hyb. sim). Observed heterozygosity was calculated as the proportion of heterozygous markers in each simulated population (intra=blue line, hybrid= pink line) and for the actual genotypes in the populations (black line). The kernel density distribution is plotted against the observed heterozygosity for both the 3xApo accessions (a) and the 2xApo accessions (b). The mean heterozygosity of sexual diploids is labeled in each plot. P-values from pairwise t-test report the significance of the difference between the mean simulated and real data.

