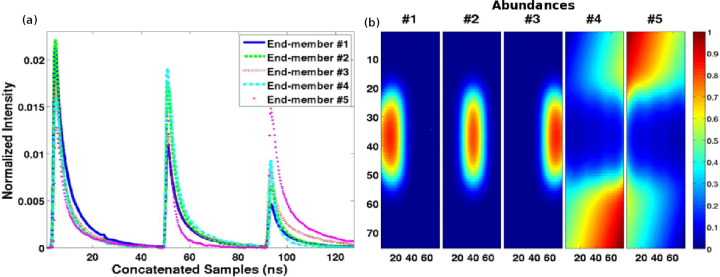
Fig. 1.
The 5 synthetic end-members (a) and their abundance maps (b), with purity level ρ = 1, employed in the synthetic evaluation. The end-members of 510 samples represent the concatenated fluorescence intensity time-decays at three different wavelength bands. The x and y positions (75 × 75) in (b) correspond to spatial coordinates in the sample, while the color depicts the quantitative abundance values.

