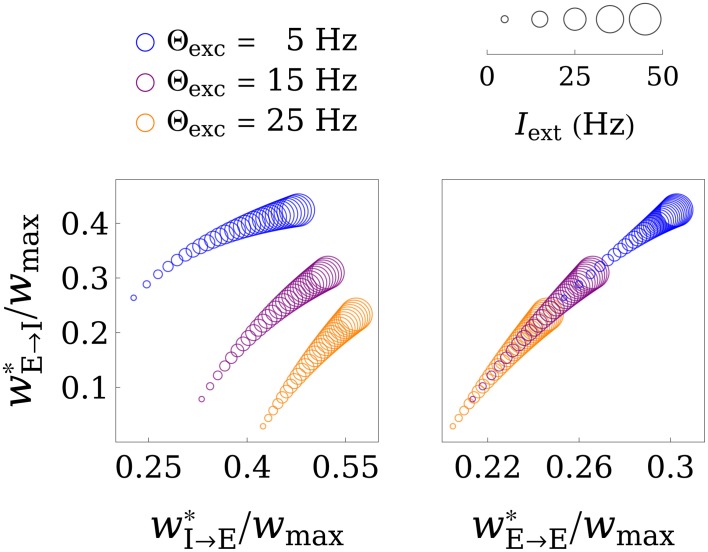
Figure 3.
Illustration of the fixed point in weight space. The values of the final weights (in units of wmax) are plotted as functions of the parameter Θexc and the training input strength Iext, where bigger circles correspond to greater Iext. The left panel shows the wE→I-wI→E plane, while the right panel shows the wE→I-wE→E plane. Interestingly, the fixed point in wE→I-wE→E space only gets shifted along a line for different values of Θexc and Iext. For Iext → ∞ the weights converge to a limit point, as is illustrated in Figure 4. For these plots, the parameters Aexc and Θinh were set to 2 and 18 Hz, respectively, and wmax was set to 4.

