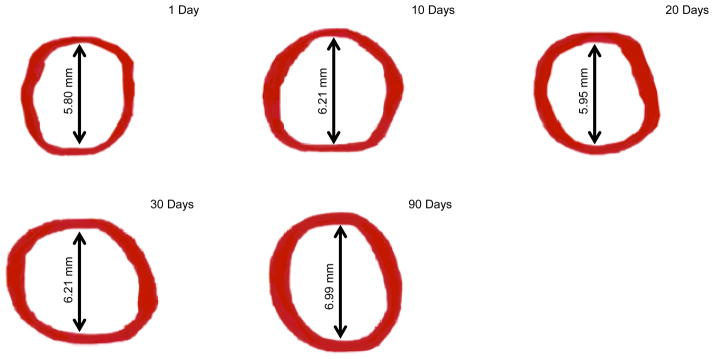
Figure 5.

Reconstructed images of ciliary muscle volume at 1, 10, 20, 30, and 90 days of age. Note that each arrow and associated value represents the mean inner ciliary muscle ring diameter at the listed time-point. Also note that superior and inferior ring thinning can be seen in some images; this artifact is due to the software during the reconstruction process.
