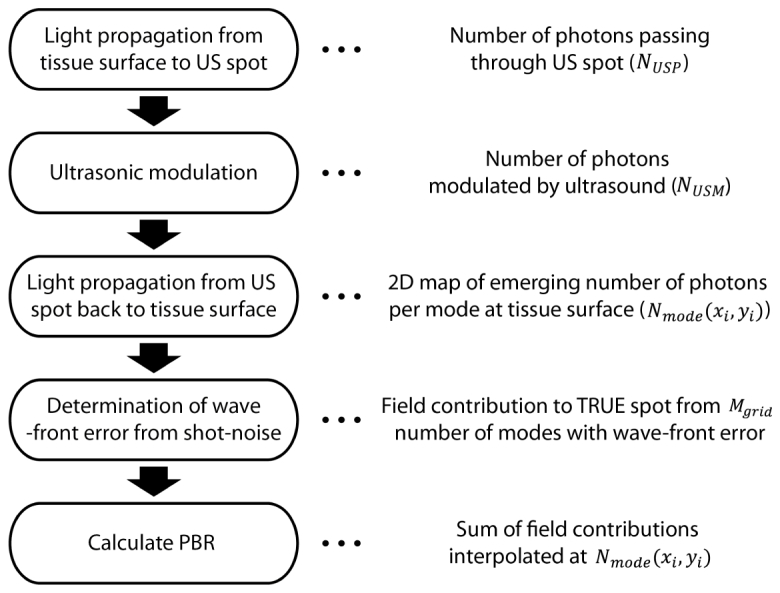
Fig. 2.

Flow chart of simulation procedure. 2D photon flux map emerging from the tissue surface is calculated from the first three steps regarding light propagation and ultrasonic light modulation. Then, wavefront measurement error resulting from shot-noise is determined to calculate the field contribution from number of modes to the TRUE focal spot (). In the last step, PBR is calculated by summing up the field contributions from each simulation grid cell. Here, we use the lookup table approach (field contribution is interpolated from) that we will describe in detail at Section 2.3.2 and 2.3.3.
