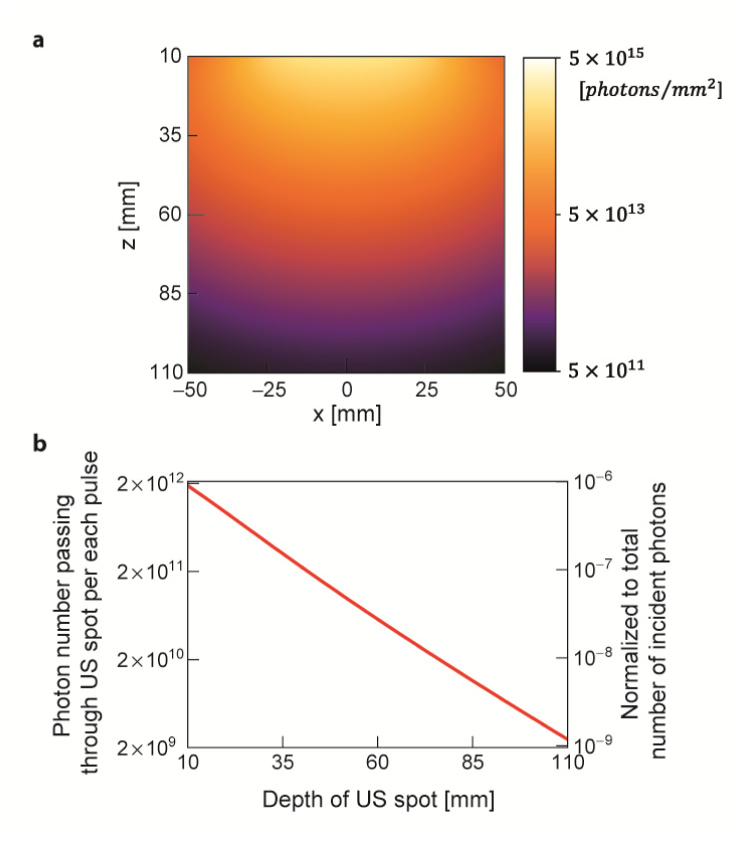
Fig. 3.
(a) Longitudinal sectional photon fluence map of the light beam propagating through the biological tissue corresponding to a single light pulse at the safety limit. The map is plotted in log scale. The wavelength is . We calculated the number of photons passing through the US spot () by multiplying the photon flux at target depth with the longitudinal cross-sectional area of US spot. (b) Number of photons passing through the US spot is plotted along depth. The scale on the right axis represents the corresponding photon numbers normalized by the number of incident photons. The plot is in log scale.

