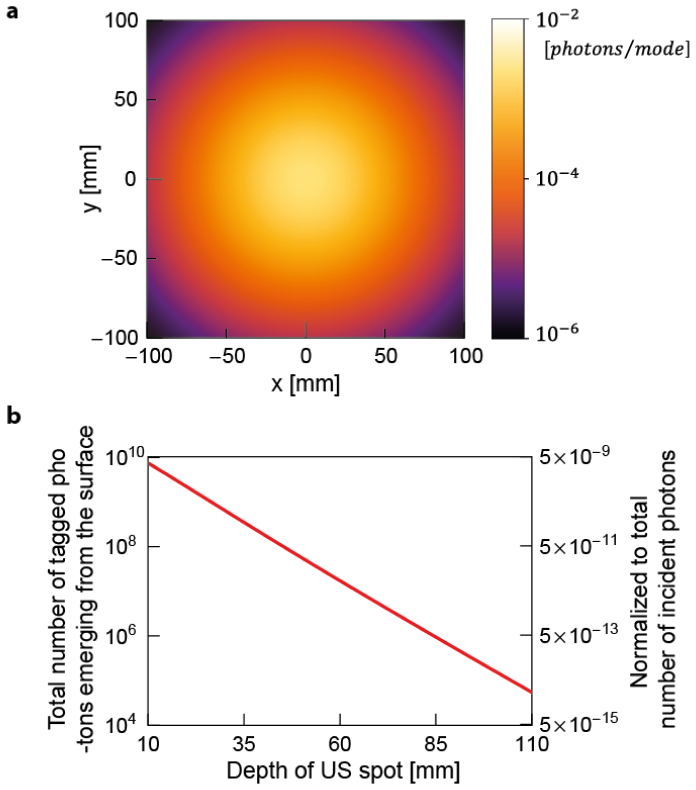
Fig. 5.
(a) 2D photon flux map of ultrasonically modulated light emerging from the tissue surface from a single incident light pulse. The map is plotted in log scale. The target depth is and the wavelength is . We calculated the average number of photons per mode () by dividing the photon flux at each grid cell () by the number of modes inside each grid cell (). (b) The total number of emerging photons at the surface is plotted for various depths. The scale on the right axis represents corresponding photon numbers normalized by the number of incident photons. The plot is in log scale.

