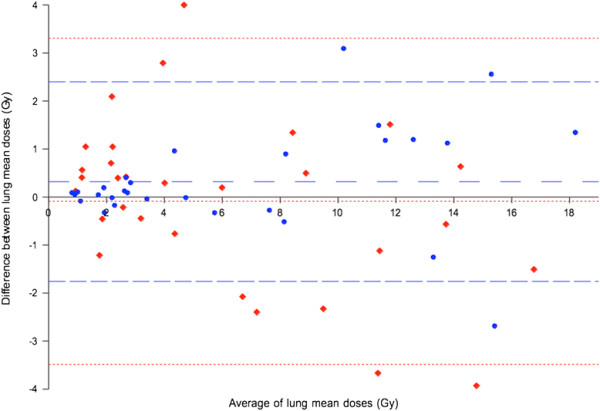
Figure 7.

Combined Bland-Altman plots of lung mean doses by planar and SPECT/CT methodologies. Planar (red diamonds) and SPECT/CT (blue circles) methodologies were each respectively compared to the reference Dmean. Fine red and coarse blue horizontal dashed lines indicate the bias and 95% LOA for planar and SPECT/CT methodologies, respectively.
