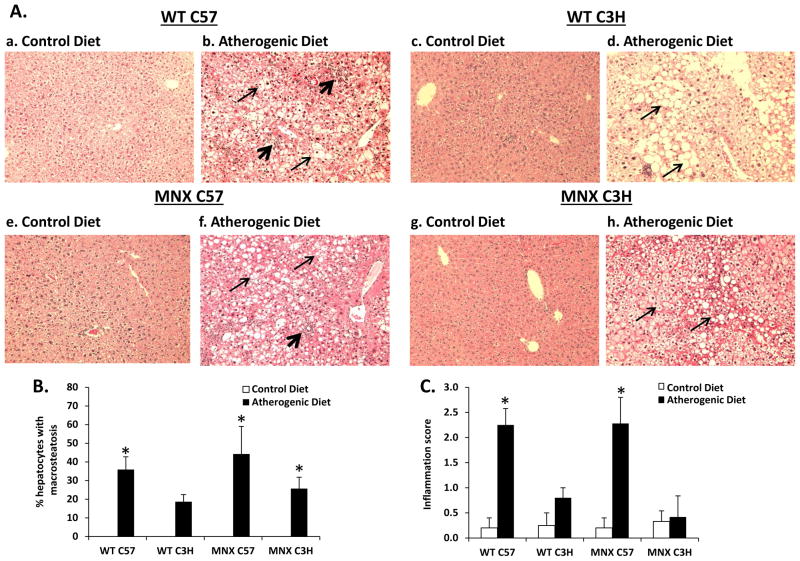
Figure 1. Effect of diet, genotype, and haplotype on liver histology.
Liver macrosteatosis and inflammatory foci were assessed in H&E stained sections for mice groups: WT C57, WT C3H, MNX C57, and MNX C3H. (A) Representative photomicrographs of H&E stained sections are shown from WT C57 (a, n=5), WT C3H (c, n=4), MNX C57 (e, n=5), and MNX C3H (g, n=6) mice fed the control diet; and WT C57 (b, n=16), WT C3H (d, n=15), MNX C57 (f, n=7), and MNX C3H (h, n=7) mice fed the atherogenic diet (magnification × 400). The narrow and wide arrows indicate hepatocyte steatosis and inflammatory infiltration, respectively. (B and C) Bar graphs representing % hepatocytes with macrosteatosis and inflammation score, respectively. Steatosis was not present in livers from mice fed the control diet and was scored as ‘0’; thus, no bars are given for control diet groups. Results are expressed as mean ± SE. *p<0.05, compared to corresponding control diet counterpart.

