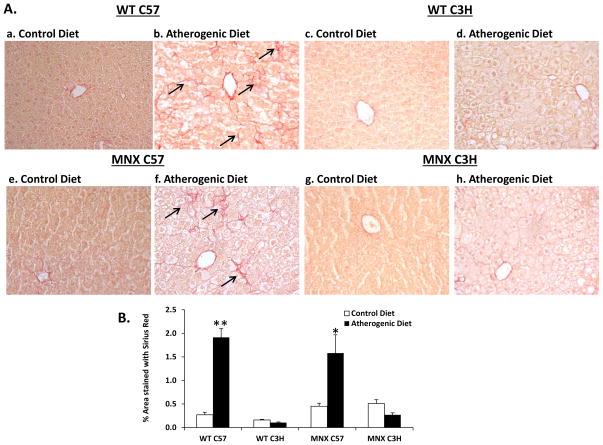
Figure 2. Effect of diet, genotype and haplotype on liver fibrosis.
Staining of collagen fibers was assessed for mice groups: WT C57, WT C3H, MNX C57, and MNX C3H. (A) Representative photomicrographs of Sirius Red-stained liver sections are shown WT C57 (a, n=5), WT C3H (c, n=3), MNX C57 (e, n=4), and MNX C3H (g, n=4) mice fed the control diet; and WT C57 (b, n=7), WT C3H (d, n=5), MNX C57 (f, n=6), and MNX C3H (h, n=5) mice fed the atherogenic diet (magnification × 400). The arrows indicate Sirius Red-stained collagen fibers. (B) Bar graph representing % area stained with Sirius Red. Results are expressed as mean ± SE. *p<0.05 or **p<0.0001, compared to corresponding control diet counterpart. ANOVA results are provided in Supplemental Table 1 and p values for pair-wise comparisons are provided in Supplemental Table 3.

