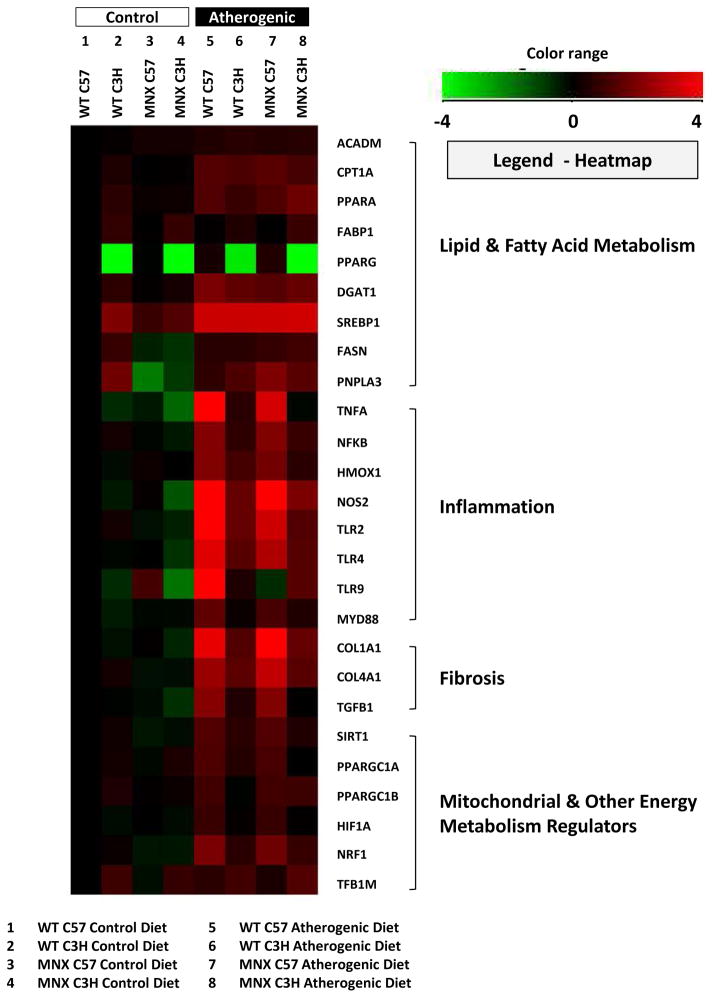
Figure 3. Effect of diet, genotype, and haplotype on lipid metabolism, inflammation, and fibrosis genes.
Gene expression was determined for mice fed the control and atherogenic diets: WT C57, WT C3H, MNX C57, and MNX C3H. Results were normalized based on a change in expression from WT C57 mice fed the control diet. The sample size for each measurement was n=4 mice per group. Gene expression results were transformed (log2) and plotted in a heatmap generated using Genespring ver12.6 (Agilent Technologies, Inc., Santa Clara, CA). Down-regulated genes (relative to WT C57 Control Diet) are shown in green, and up-regulated genes (relative to WT C57 Control Diet) are shown in red. ANOVA results are provided in Supplemental Table 2 and p values for pair-wise comparisons are provided in Supplemental Table 3.

