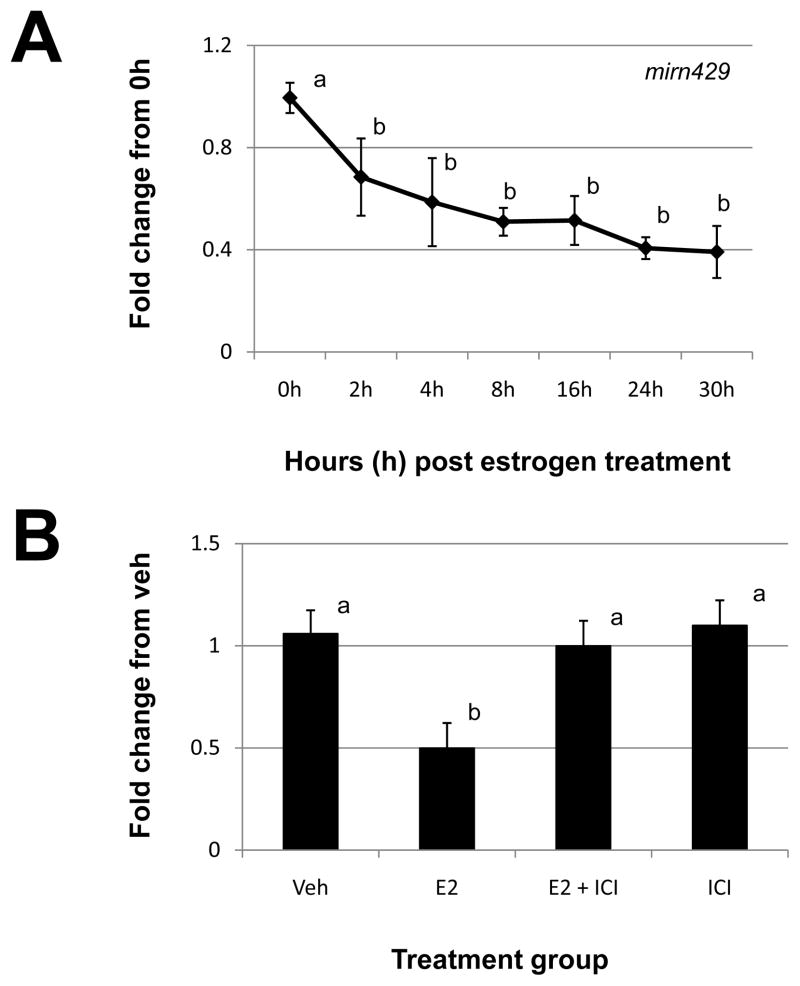
Figure 1. Estrogen regulation of uterine mirn429.
(A) Uterine mirn429 expression was quantitated by qRT-PCR as described in “Materials and Methods” after estrogen administration to ovariectomized mice. (B). Specificity of estrogen modulation was confirmed using the estrogen receptor antagonist, 182,780 ICI (ICI). Data were normalized to the level of U6 expression and are expressed as the fold change from 0h (A) or vehicle (Veh; B) ± SD. Data are representative of 4 to 5 data points/time point or treatment group (N≥4). Different letters indicate statistical significance among the means as determined by one-way ANOVA. Significance was set at P<0.05 for all analysis.

