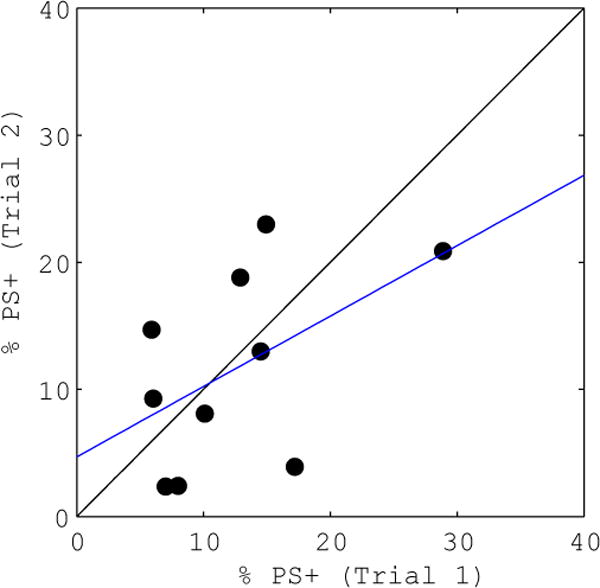
Figure 4. CVX-SFLLRN induced phosphatidylserine (PS) exposure correlation.

The percentage of cells exposing PS in each donor’s first sample (abscissa) is compared with the percentage measured in the second sample (ordinate) for the addition of convulxin and SFLLRN. The linear regression (blue line) shows correlation between trials (R2 = 0.2577).
