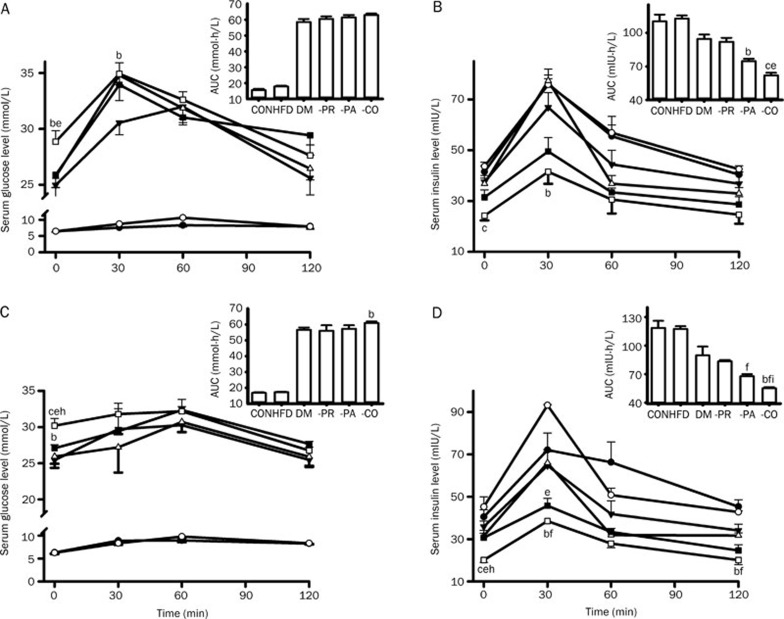
Figure 2.
Effects of pravastatin, paroxetine and their comedication on postprandial glucose concentrations (A, C) and postprandial insulin concentrations (B, D) in rats after oral glucose loading (2 mg/kg). (A and B) on d 15; (C and D) on d 28. Symbols represent CON (black circles), HFD (white circles), DM (black triangles), DM-PR (white triangles), DM-PA (black square) and DM-CO (white square). Data represent the mean±SEM of 4–6 rats. bP<0.05, cP<0.01 vs DM rats. eP<0.05, fP<0.01 vs DM-PR rats. hP<0.05, iP<0.01 vs DM-PA rats.

