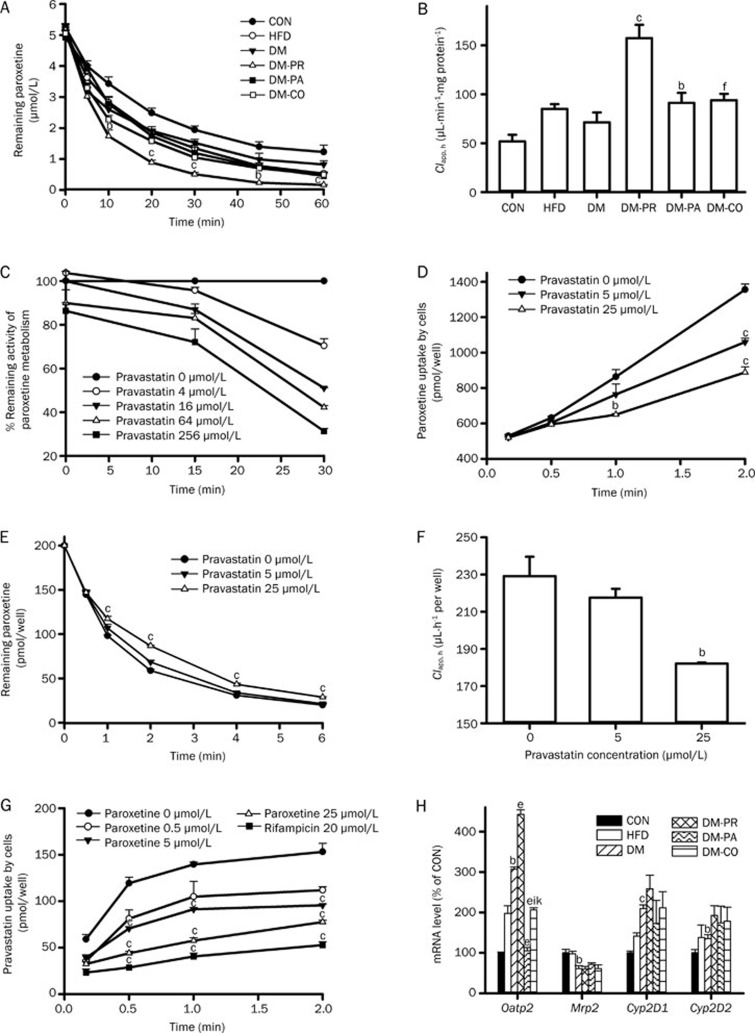
Figure 7.
(A) Paroxetine metabolism (5 μmol/L) in hepatic microsomes of rats and (B) corresponding paroxetine clearance parameters in hepatic microsomes (Clapp, h). bP<0.05, cP<0.01 vs DM rats. fP<0.01 vs DM-PR rats. (C) The time- and concentration-dependent inhibitory effect of pravastatin on paroxetine metabolism in diabetic rat hepatic microsomes. (D) The inhibitory effect of pravastatin on the uptake of paroxetine by hepatocytes. (E and F) Effects of pravastatin on the depletion of paroxetine (0.2 μmol/L) by hepatocytes and corresponding paroxetine clearance parameters in hepatocytes. (G) The inhibitory effect of paroxetine on the uptake of pravastatin in hepatocytes. Data represent the mean±SEM of 3–4. bP<0.05, cP<0.01 vs control. (H) Effects of paroxetine, pravastatin and their comedication on the expression of target gene mRNA of rats after 28 d treatment. bP<0.05, cP<0.01 vs CON rats. eP<0.05 vs DM rats. iP<0.01 vs DM-PR rats. kP<0.05 vs DM-PA rats.

