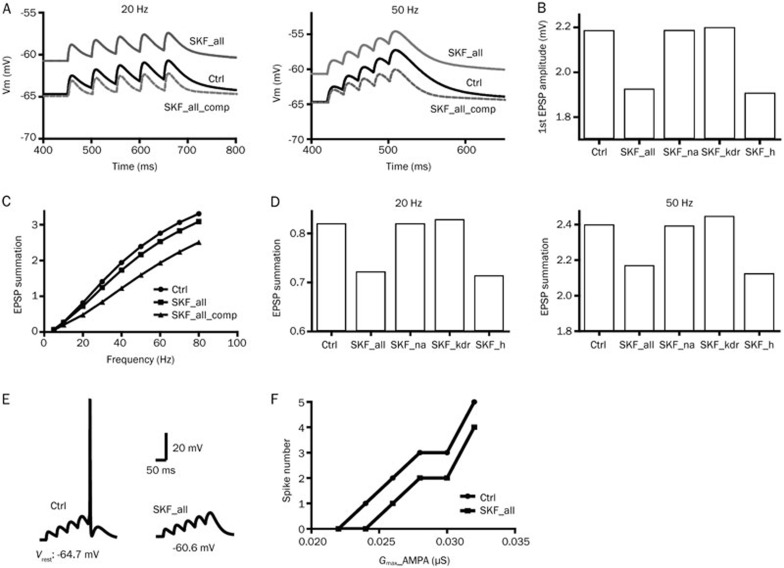
Figure 7.
Effects of SKF83959 on EPSP temporal summation in simulations. EPSP temporal summation was measured as described in the methods. (A) Example traces of EPSP temporal summation during a train of 5 stimuli of either 20 Hz (left) or 50 Hz (right) with Gmax_AMPA set to 0.009 μS. EPSP temporal summations for control cells (solid black lines) and SKF83959 treated cells without (solid gray line) and with (dashed, gray line) membrane potential compensation. (B) The amplitude of the first EPSP without membrane potential compensation. (C) EPSP temporal summation ratio in response to a series of frequencies from 5 Hz to 80 Hz with or without membrane potential compensation. (D) EPSP temporal summation ratio in response to 20 Hz (left) and 50Hz (right) stimulations under different conditions without membrane potential compensation. (E) Example traces showing EPSP-spike coupling without membrane potential compensation (Gmax_AMPA: 0.024 μS). (F) Spike numbers in response to a series of values for Gmax_AMPA under either control or SKF83959 treated conditions, without membrane potential compensation. SKF_all, SKF_all_comp, SKF_na, SKF_kdr, and SKF_h are the same as in Figure 4.

