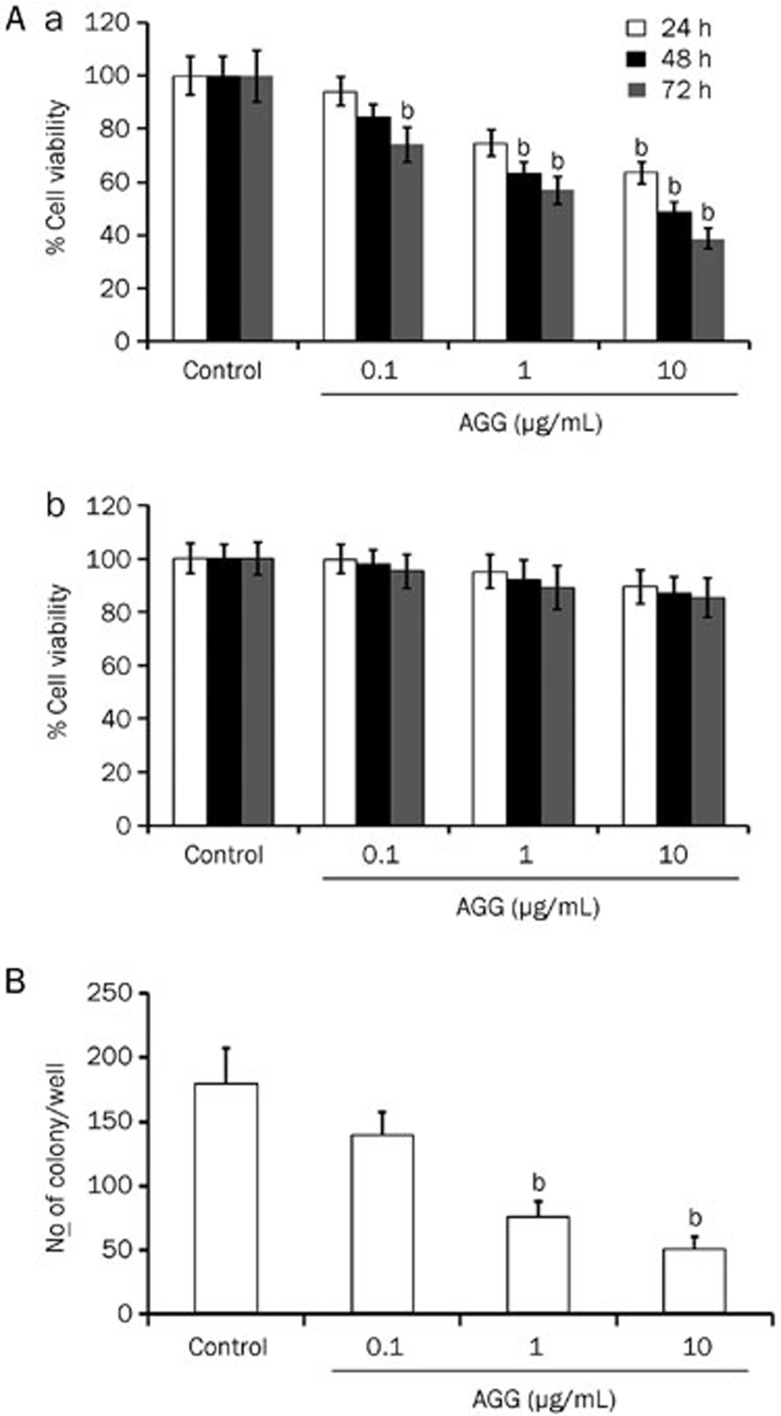
Figure 1.
Effect of AGG on cell viability and growth. (A) HepG2 (a) and HaCaT cells (b) were treated with AGG at the indicated concentrations for 24, 48 and 72 h with six replicates in each concentration. Cell viability was measured using a MTT assay. Data are reported as the mean±SD of six different observations and compared to the PBS control using Student's t-test. (B) After 12 h of treatment with AGG, HepG2 cells were processed as described in the 'Methods'. The colonies that formed were stained with 0.5% crystal violet (in methanol/water, 1:1) and counted. bP<0.05 vs control.

