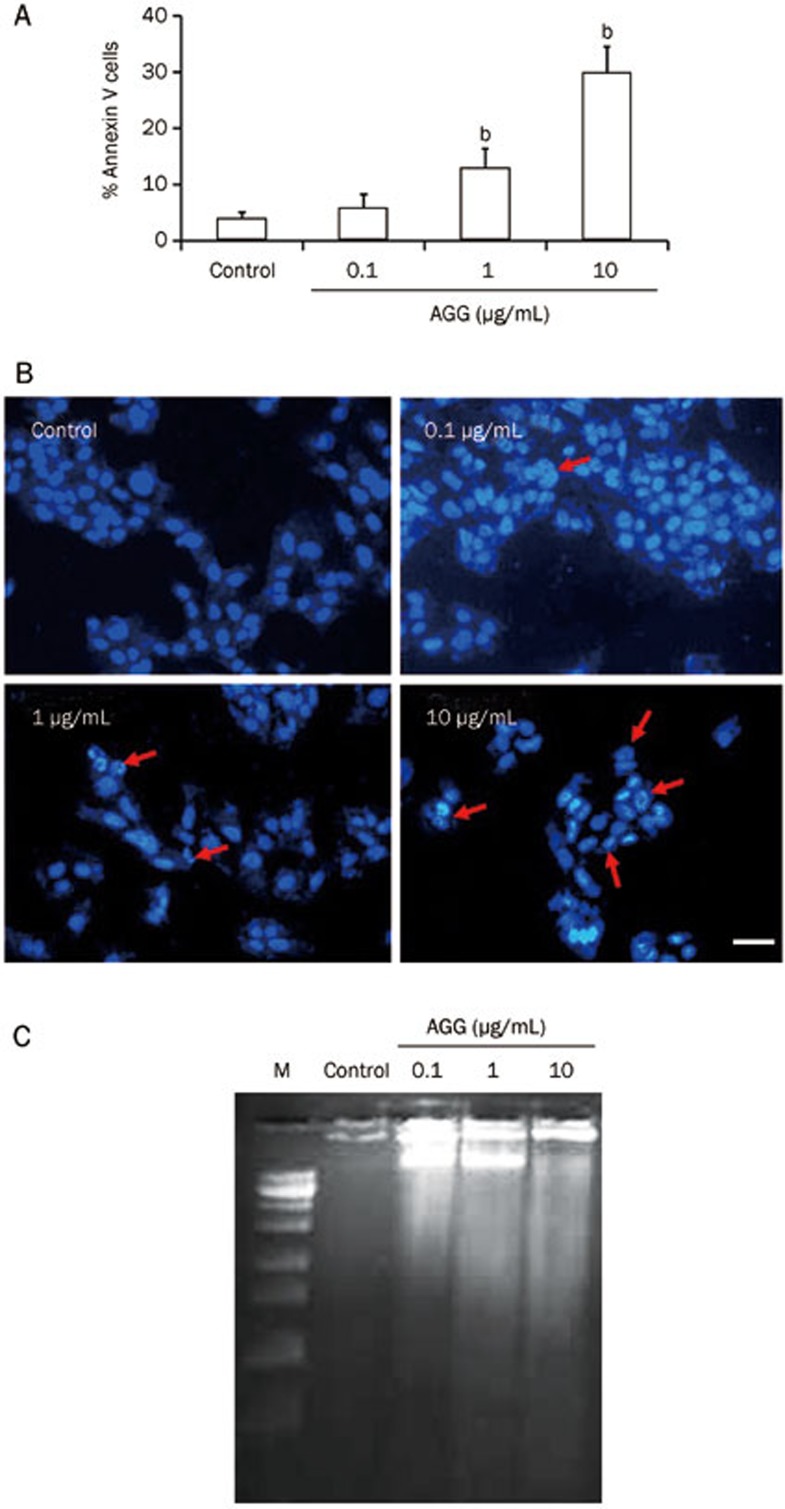
Figure 2.
Effect of AGG on apoptosis induction in HepG2 cells. (A) HepG2 cells were treated with different concentrations (0.1, 1.0 and 10 μg/mL) of AGG for 24 h and then assayed for the % Annexin V-positive cells. bP<0.05 vs control. (B) The morphological changes in the nuclei of HepG2 cells between the control and treated groups were studied after fixing the cells with 3.7% paraformaldehyde for 15 min, permeabilizing with 0.1% Triton X-100 and staining with 1 μg/mL DAPI for 5 min at 37 °C. The cells were then washed with PBS and examined by fluorescence microscopy (Olympus IX71, 200×). The arrow marks indicate condensed and fragmented nuclei in the abovementioned dose-treated groups. The scale bar represents 50 μm. (C) Twenty-four hours after the AGG treatments at the indicated doses, the HepG2 cells were analyzed for DNA fragmentation by ethidium bromide staining ('M' indicates DNA ladder).

