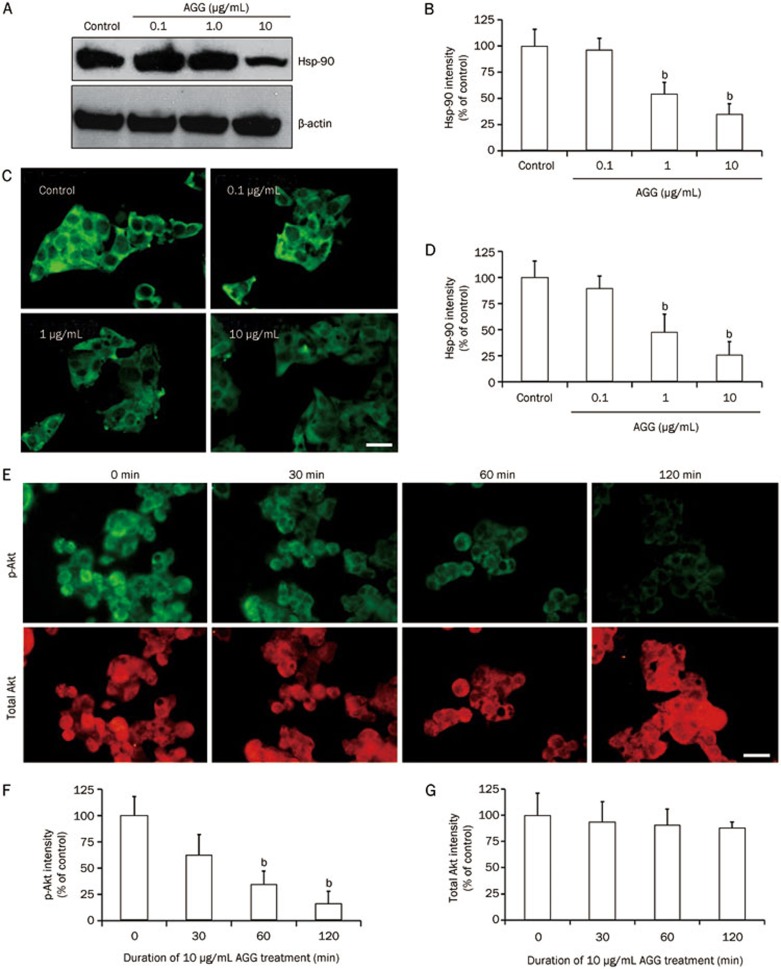
Figure 5.
AGG reduces Hsp90 expression and suppresses Akt phosphorylation in HepG2 cells. The expression of Hsp90 was analyzed by Western blotting (A, B) and immunocytofluorescence (C, D) after 24 h AGG treatment at the indicated doses. The HepG2 cells were treated with AGG (10 μg/mL) for different durations, and the expression of p-Akt and total Akt were analyzed by immunocytofluorescence (E–G). The scale bar represents 20 μm. The data are reported as the mean±SD. bP<0.05 vs control. All images and blots were quantified using the ImageJ software.

