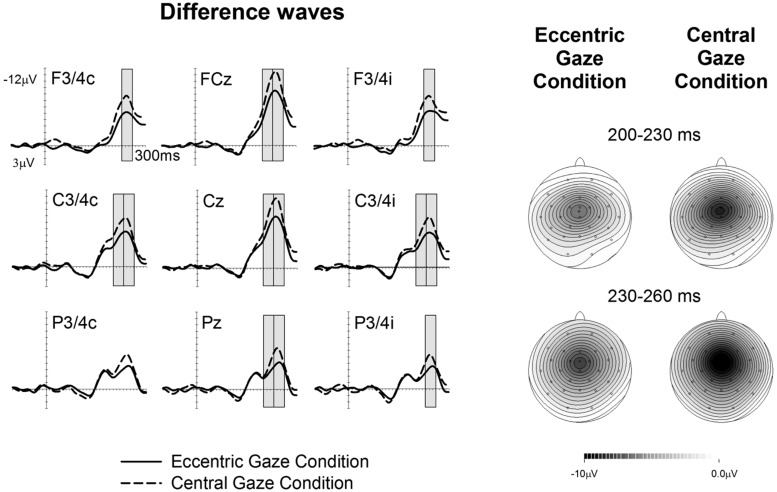
FIGURE 3.
Difference waveforms are obtained by subtracting the ERPs elicited by tactile non-target stimuli presented to the unattended hand from ERPs elicited by stimuli presented to the attended hand, with solid vs. dashed lines indicating the Eccentric gaze and Central gaze conditions, respectively. Gray boxes represent the time windows in which significant differences were observed between attentional modulations in the Eccentric and Central gaze conditions. The corresponding topographical voltage maps of attention effects for tactile ERPs are shown separately for the Eccentric gaze and Central gaze conditions for the 200–230 ms, and 230–260 ms intervals after stimulus onset, and are computed by spherical spline interpolation. Amplitude scales range between –10 and 0 μV for the Eccentric gaze condition and –10 to 0 μV for the Central gaze condition.

