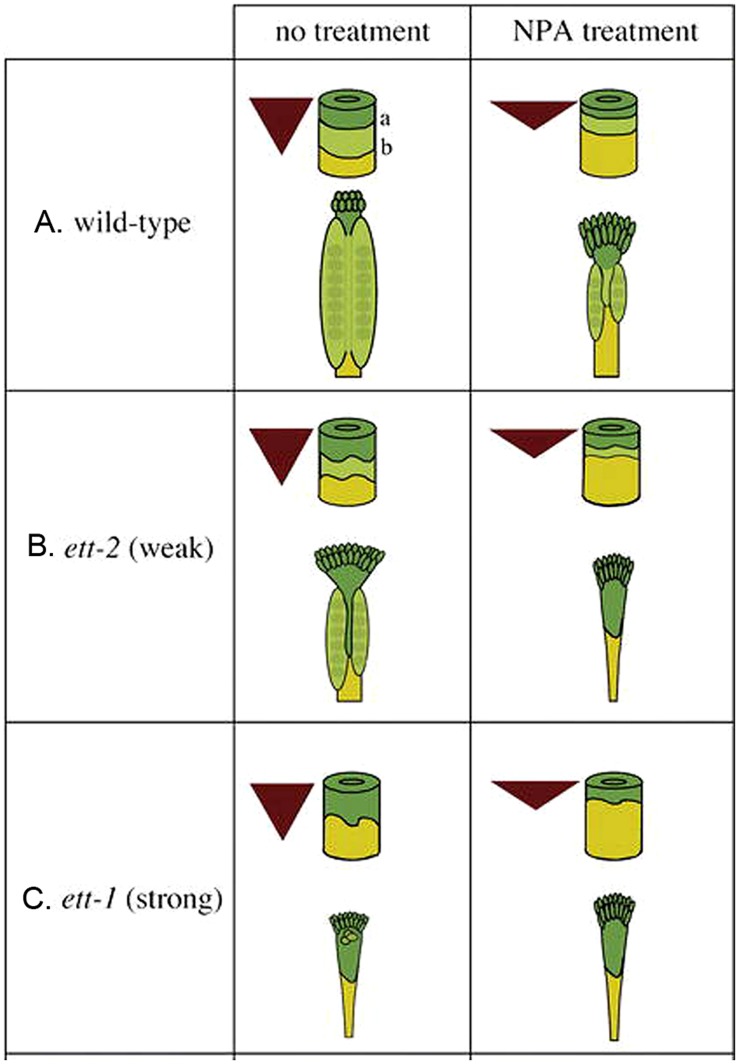
FIGURE 3.
The auxin gradient model. Auxin is produced at the apex and transported toward the base, creating a morphogenic gradient that provides positional information, which is interpreted in part by ETT to specify ovary valve. The triangle represents the auxin gradient within the gynoecium. The cylinder represents the gynoecium with border marked “a” between the style (dark green) and ovary (light green) and border marked “b” between the ovary and gynophore (yellow). (A) Wild-type gynoecia with and without NPA treatment. (B) Weak ett-2 mutants with a mild phenotype (left); the phenotype is significantly enhanced when ett-2 mutants were treated with NPA (right). (C) Strong ett-1 mutants with a strong phenotype with or without NPA treatment. The figure is reproduced from Nemhauser et al. (2000) with permission from Copyright Clearance Center.

