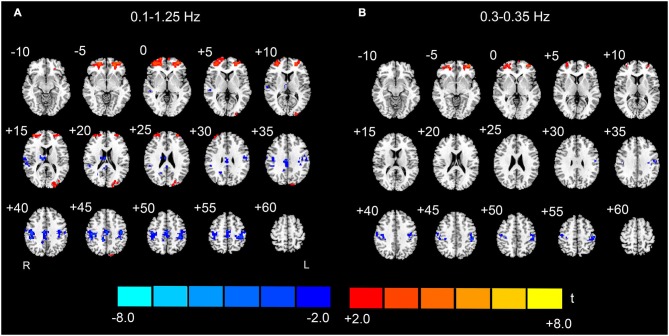
Figure 7.
Conjunction maps of the EO-EC high-frequency AF differences across the split-half subgroups. The results for the entire high-frequency band (0.1–1.25 Hz) are shown on the left (A), and the results of one high-frequency sub-band (0.3–0.35 Hz) are shown on the right (B). Conjunction results at frequencies >0.35 Hz appear noisy and are not shown. Warm colors indicate the jointly significant increase of high-frequency AF in EO than EC, and the cold colors indicate the opposite (p < 0.05, corrected). The left side of the figure corresponds to the right side of the brain.

