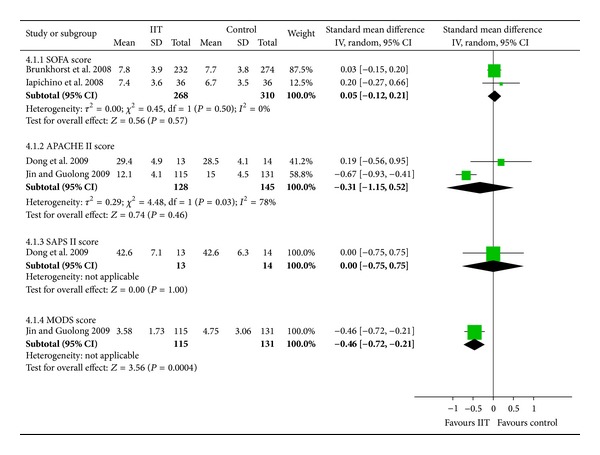
Figure 4.

Forest plot with severity of illness showing no significant difference between IIT and control groups in SOFA, APACHE II, and SAPS II scores, with a reduction of MODS score with IIT. IIT: intensive insulin therapy. SD: standard deviation. CI: confidence interval. IV: inverse variance.
