Figure 5.

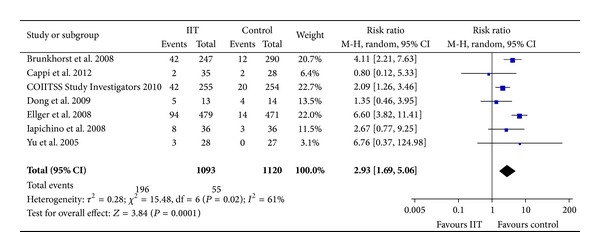
Forest plot showing that IIT increased the risk of hypoglycemia. IIT: intensive insulin therapy. CI: confidence interval. M-H: Mantel-Haenszel.

Forest plot showing that IIT increased the risk of hypoglycemia. IIT: intensive insulin therapy. CI: confidence interval. M-H: Mantel-Haenszel.