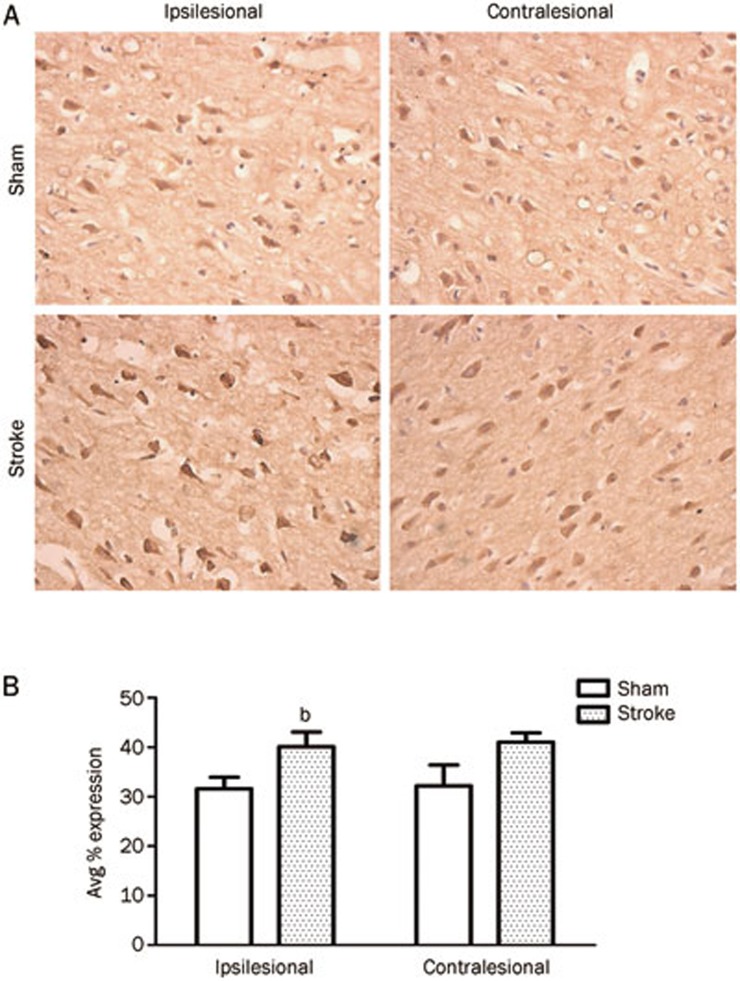
Figure 5.
BDNF expression. (A) Representative images of BDNF expression in the ipsi- and contralesional hemisphere. (B) Quantification of the percent cells expressing BDNF in stroke and sham treated rats. Following surgery, Sham animals showed BDNF expression from 31.6%±2.7% (SEM) cells, compared to Stroke animals with 40.1%±3.4% expressing the protein. In the contralesional hemisphere there were no significant differences in percent BDNF expression, although there was a tendency for stroke animals to have greater percent expression [Sham=32.2%±4.8% (SEM); Stroke=41.0%±2.2%; P>0.05). n=4; bP<0.05.

