
Figure 3.
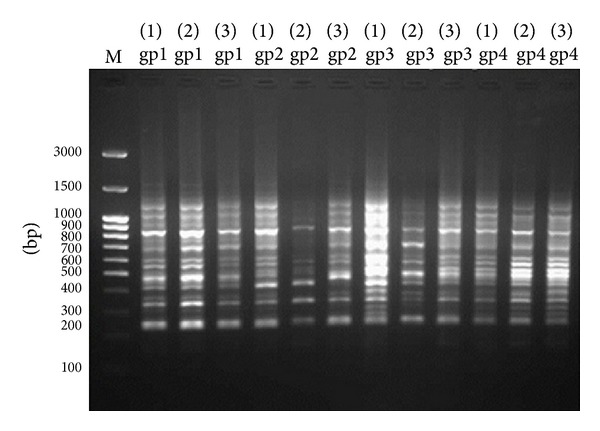
Pattern RAPD-PCR (primer 1) of hepatic DNA samples exposed to lead acetate and treated with two doses of Omega-3 using primer 1. The DNA ladder is in lane (M); lanes (gp1) represent group 1 (−ve control), lanes (gp2) group 2 (Omega-3 with dose 125 mg/kg body weight and lead acetate), lanes (gp3) group 3 (Omega-3 with dose 260 mg/kg body weight and lead acetate), and lanes (gp4) group 4 (+ve group).