
Fig.3.
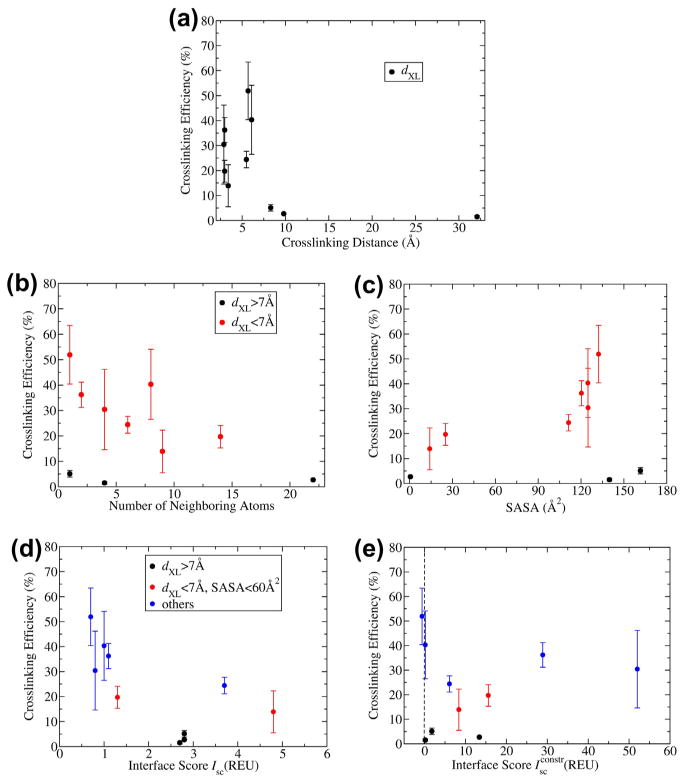
Plots relating the biophysical criteria to experimental crosslinking efficiency. Error bars display the standard deviations obtained from multiple trials in experiments. (a) Effect of crosslinking distance. (b and c) Effect of solvent accessibility by (b) l-DOPA neighboring atoms or (c) solvent-accessible surface area. Black circles represent positions with dXL over 7 Å (H_G55, H_I51, and L_D17). (d and e). Effect of interface energetics by (d) interface energy or (e) crosslink fluctuation energy. Again black circles represent positions with dXL over 7 Å, and additionally red circles represent positions with solvent-accessible surface area under 60 Å (H_Y52 and H_W33).