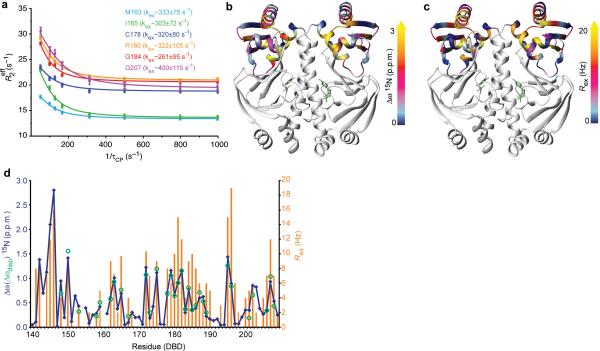
Figure 4.
CAP-S62F-cAMP2 visits an active, low-populated conformational state. (A) Representative relaxation dispersion data of 15N backbone amides of CAP-S62F-cAMP2 DBD residues. (B) Backbone 15N chemical shift differences of the DBD residues between the apo and cAMP2-bound WT-CAP mapped on the structure. (C) Conformational exchange dynamics of CAP-S62F-cAMP2 on the μs – ms timescale as indicated by Rex, are mapped on the structure. (D) Plot of 15N static Δδ values (blue), Rex values (orange), and dynamic Δδ (green).

