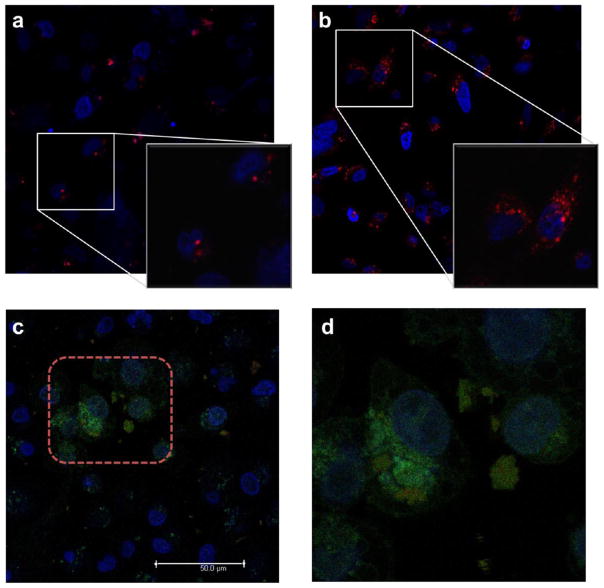
Figure 8.
Confocal images of MDA-MB-468 breast cancer cells treated with nonactivated (a) or light activated (b) MSNPs 2. Confocal images (c, d) showing MSNPs 2 loaded with FITC uptake by MDA-MB-468 cells after photoactivation in the selected region (red square) for 30 min. The merged view shows the red emission from ruthenium(II) aqua complex (λex = 458 nm, λem = 590–630 nm), the green emission from fluorescein (λex = 488 nm, λem = 500–530 nm), and the blue emission from DAPI (λex = 405 nm, λem = 440–470 nm). Note an effective increased emission (d) from fluorescein inside the irradiated area (red square), while the nonactivated region displays a lower intensity.

