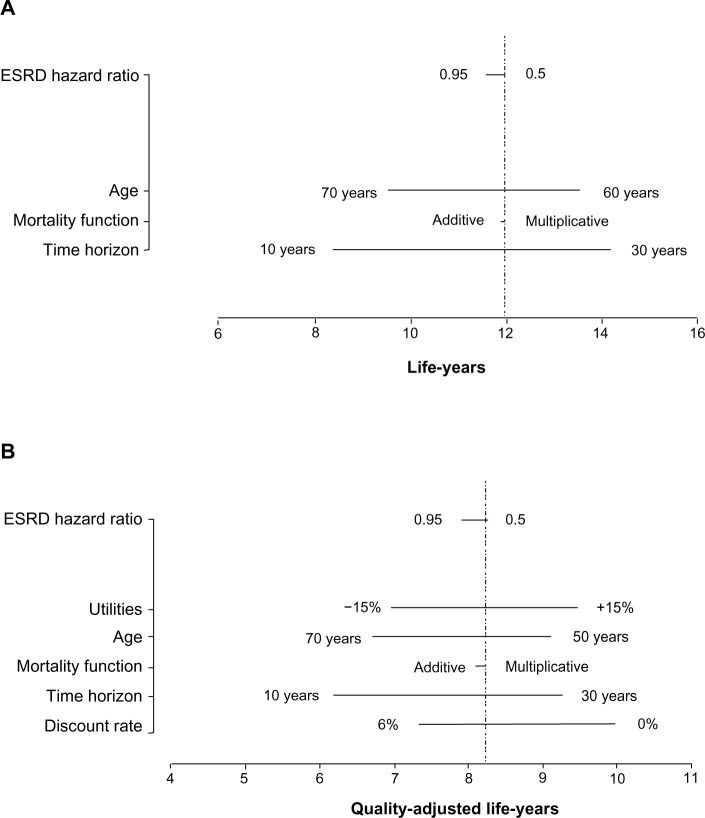
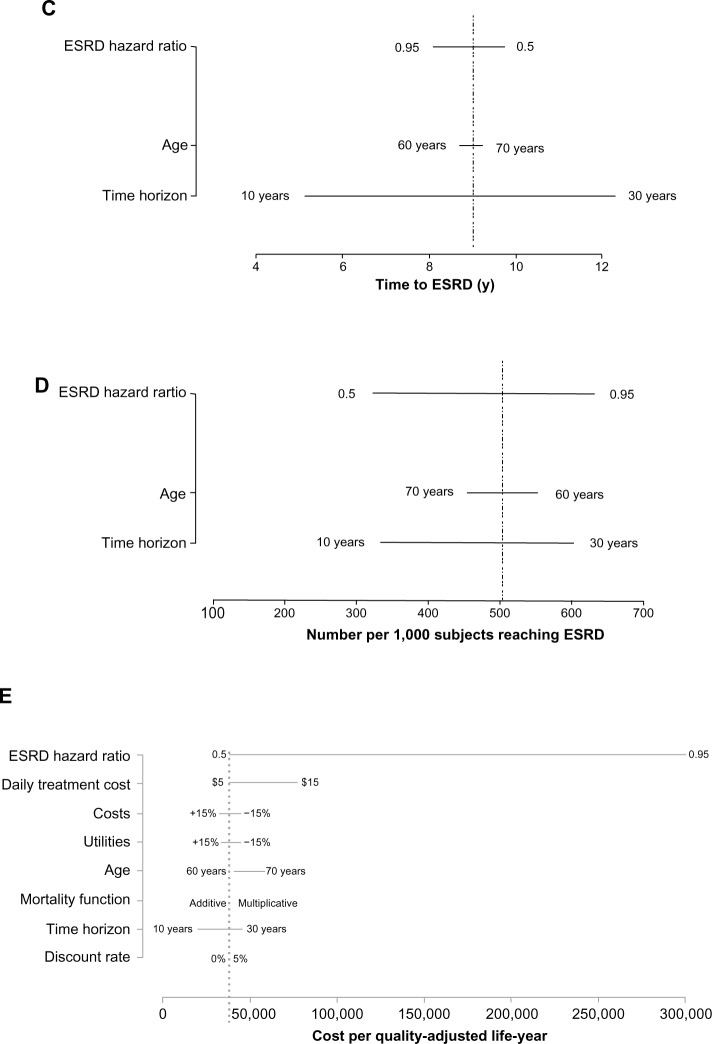
Figure 4.
Tornado plots showing the results of one-way sensitivity analyses demonstrating the impact of specific variables on: (A) life-years; (B) quality-adjusted life-years; (C) time to ESRD (y); (D) number per 1,000 subjects reaching ESRD; and (E) cost per quality-adjusted life-year.
Abbreviations: ESRD, end-stage renal disease; y, years.


