Figure 2.

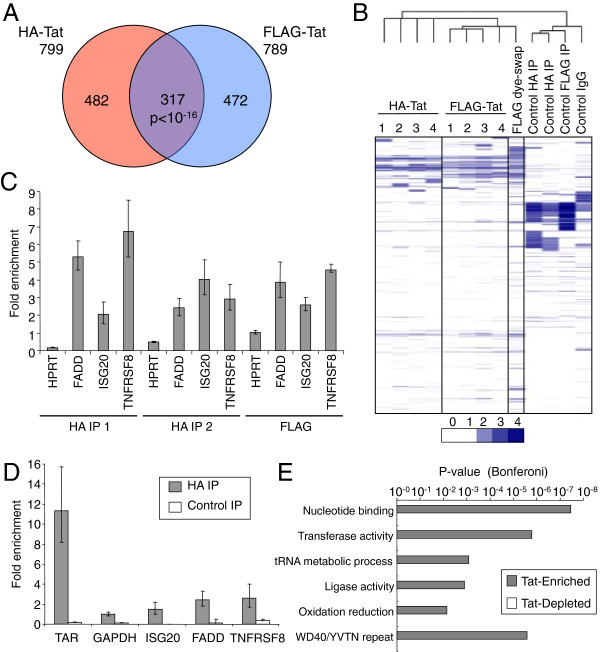
Tat interacts with human mRNA in cells. A. Venn diagram showing cellular RefSeq mRNAs enriched by IP for HA-Tat or FLAG-Tat. The overlap between the two sets of RNAs is significant at p < 10-16 (Hypergeometric). B. Clustered heat-map of the RNA IP data. Fold-enrichment of mRNA in the IP fraction relative to input RNA is shown as shades of blue, according to the scale below. Samples (columns) and mRNAs (rows) are clustered by their enrichment pattern with genes and samples with similar patterns of enrichment grouped together. The numbers 1–4 signify the 4 different probes present on the arrays used to measure enrichment by HA and FLAG-Tat IP. The arrays used for the other experiments only contain probe number 4. The similarities between the pattern of RNA enrichment for each experiment is related by the tree shown above. C. Enrichment (mean and SD) of the human mRNAs FADD, ISG20 and TNFRSF8 in replicate HA-Tat and FLAG-Tat IPs relative to GAPDH mRNA, measured by Q-PCR. An additional negative control, HPRT mRNA, was enriched between 0.2-1-fold. D. Enrichment (mean and SD) of the human mRNAs GAPDH, FADD, ISG20 and TNFRSF8 in HA-Tat immunoprecipitate from formaldehyde cross-linked cells, measured by Q-PCR. The p-values for enrichment versus GAPDH were TAR RNA p = 0.0046, ISG20 p = 0.1778, FADD p = 0.0185 and TNFRSF8 p = 0.0395 (t-test, n = 3). Enrichment of RNA by anti-HA IP from FLAG-Tat cells was performed as a negative control. E. Bonferoni-modified p-value for the association of functional gene categories with enlarged sets of ~2000 genes enriched or depleted in HA-Tat and FLAG-Tat IPs. .
