Figure 3.

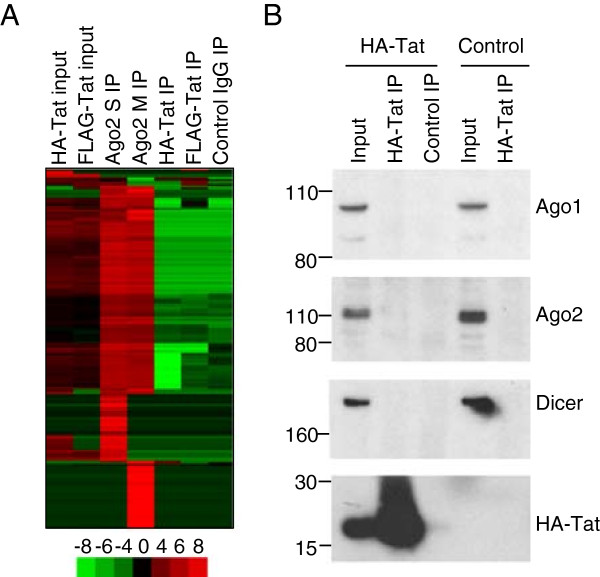
Tat does not associate with miRNAs or with RISC components. A. Clustered heat-map showing the amount of cellular miRNAs in HA-Tat and FLAG-Tat cells and in Ago2, Tat and control IgG IP. Ago2 was immunoprecipitated with two different antibodies (M and S). Samples (columns) and miRNAs (rows) are clustered by their enrichment pattern. miRNA abundance compared to the average across all samples is indicated by colour, according to the scale below (log2 ratio). B. Immunoblotting for Ago1, Ago2, Dicer and HA-Tat in input and HA-Tat IP lysates from HA-Tat cells and control FLAG-Tat cells. The position of size markers are illustrated on the left hand side of each panel.
