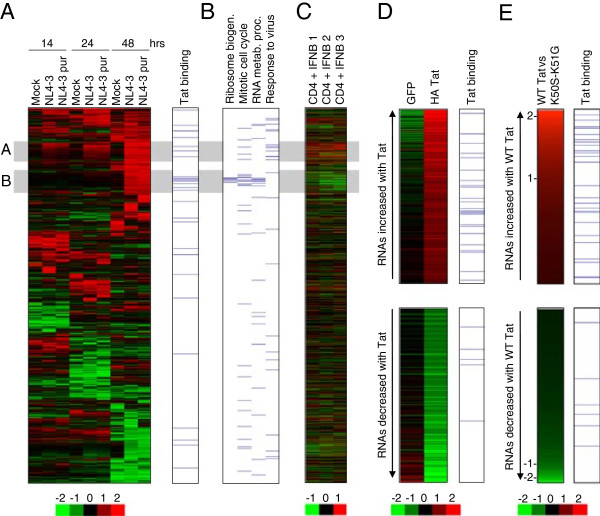
Figure 6.

RNAs associated with Tat show increases in transcript abundance. A. Clustered heat-map showing changes in RNA abundance in primary CD4+ T cells after mock infection or infection with purified or unpurified HIV (NL3-4) at 14, 24 and 48 hours, relative to uninfected cells at the same time point. Shades of red indicate increases in RNA abundance and shades of green indicate decreases in RNA abundance, according to the scale below (log2 ratio). RNAs associated with Tat are marked by blue lines at the right hand side. B. Genes with functions in selected Gene Ontology categories are marked with a blue line. Data are aligned with A. C. Changes in RNA abundance in primary CD4+ T cells after addition of interferon-beta (400 U/ml) for 4 hours compared to untreated cells. Data for 3 replicate experiments are shown aligned with A. D. RNAs that increase in abundance (top) and decrease in abundance (bottom) by at least 1.5-fold in CEM cells stably expressing HA-Tat compared to parental CEM cells and CEM cells stably expressing GFP. The relative abundance of each RNA is represented by colour, according to the scale below (log2 ratio). RNAs associated with Tat are marked by blue lines at the right hand side. E. RNAs that increase in abundance (top) and decrease in abundance (bottom) in cells expressing WT HA-Tat compared to cells expressing the RNA binding mutant HA-Tat K50S-K51G. The 1000 RNAs with highest and lowest relative expression in WT Tat cells compared to K50S-K51G cells are shown. The relative abundance of each RNA (log2(WT-Tat vs Tat K50S-K51G) is represented by colour, with log2 ratios marked on the left. RNAs associated with Tat are marked by blue lines at the right hand side.
