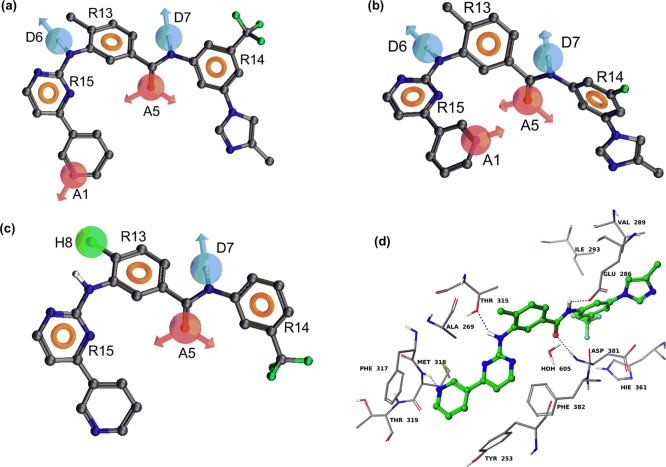
Figure 3.
Pharmacophore of nilotinib derived from the best PHASE hypothesis: (a) (AADDRRR) superimposed on the most active BCR-ABL kinase inhibitor (nilotinib); (b) (AADDRRR) superimposed on the most active P-gp inhibitor (NCGC-25); (c) (ADHRRR) superimposed on the most active ABCG2 inhibitor (NCGC-6). The hydrogen bond acceptor feature is represented by the magenta-colored sphere with arrows representing predicted directions of lone pairs (A1 and A5). The hydrogen bond donor is represented by the light blue color (D6 and D7) and the “aromatic” ring feature (R13, R14, and R15) is shown as the light brown donut-like ring. The hydrophobe feature is represented by a green-colored sphere (H8). (d) Model of binding of nilotinib within the active site of BCR-ABL kinase based on the cocrystal structure of nilotinib–ABL kinase (PDB ID 3CS9). Amino acid residues are shown as sticks with the atoms colored as carbon, gray; hydrogen, white; nitrogen, blue; oxygen, red; and sulfur, yellow, whereas nilotinib is depicted as ball and stick model with the same color scheme as above except carbon atoms are represented in green and fluorine atoms in aquamarine color. Dotted purple lines indicate hydrogen bonding interactions.

