
Fig. 2.
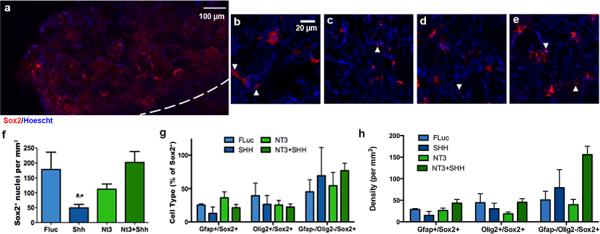
Sox2+(red)/Hoescht+(blue) nuclei 8 wks after injury. (a) Immunofluorescence of Sox2+ cells from bridge implants delivering lentivirus encoding SHH. Dashed line indicates border between bridge implant and host tissue. Sox2+ immunofluorescence at higher magnification from bridges delivering (b) FLuc, (c) SHH, (d) NT3, or (e) NT3 and SHH. Arrows indicate Sox2+ nuclei. (f) Quantification of Sox2+ nuclei in FLuc, NT3, SHH and NT3+SHH conditions (mean +/− SD). (g) Quantification of sub-populations of Sox2+/Hoescht+ nuclei (co-expression of GFAP or Olig2) as a percentage of total Sox2+/Hoescht+ cells (mean +/− SD). (h) Quantification of sub-population densities of Sox2+/Hoescht+ nuclei (co-expression of GFAP or Olig2) (mean +/− SD).